Audio Enhancement SW Tuning Guide
REVISION HISTORY
| Revision No. | Description |
Date |
|---|---|---|
| 1.0 | 07/30/2019 | |
| 1.1 | 08/05/2019 | |
| 1.2 | 09/18/2019 | |
| 1.3 | 11/10/2020 | |
| 1.4 | 12/23/2021 | |
| 1.5 | 12/28/2021 | |
| 1.6 | 09/27/2022 | |
| 1.7 | 03/23/2023 | |
| 1.8 | 12/08/2023 | |
| 1.81 | 10/08/2024 | |
| 1.82 | 12/13/2024 | |
| 1.83 | 10/07/2025 | |
| 1.84 | 10/07/2025 | |
| 1.85 | 10/21/2025 |
1. AUDIO SYSTEM INTRODUCTION – SW
1.1. Audio Block Diagram

Figure 1: Audio Enhancement Block Diagram
NOTE: AEC Hardware loopback version and SW loopback version cannot be used at the same time.
1.2. Audio Enhancement Terms and Definition
1.2.1. Acoustic Echo Cancellation (AEC)
Acoustic echo is generated when the sound played out of a speaker device is coupled back to a microphone via direct or indirect paths. Therefore, a talker at the remote end hears his or her own voice back after a tangible delay, which is known as acoustic echo (AE). Acoustic echo cancellation (AEC) refers to the echo cancellation method that prevents the talker from hearing an echo of his or her own voice.
1.2.2. De-Howling (DH)
Howling is common in the sound reinforcement system. When the microphone and the speaker are in the same space, the sound is amplified from the speaker and then picked up by the microphone, forming a sound feedback loop. When the amplification gain is large enough, self-excited oscillations will occur at certain frequency band, resulting in harsh howling. De-Howling (DH) is a function to suppress howling.
1.2.3. Acoustic Noise Reduction (ANR)
Acoustic noise reduction can reduce the noise which appears continually for a while from the environment and endures in the speech signal.
1.2.4. Equalizer (EQ)
The equalizer can enhance or attenuate some frequency band energy.
1.2.5. Automatic Gain Control (AGC)
The automatic gain control can balance the power of signal. It can enhance power if the signal level is too low, and attenuate power if the signal level is too high.
2. AEC TERMS AND DEFINITION
2.1. Acoustic Echo (AE)
Acoustic echo is generated when the sound played out of a speaker device is coupled back to a microphone via direct or indirect paths. Therefore, a talker at the remote end hears his or her own voice back after a tangible delay, which is known as acoustic echo (AE). Acoustic echo cancellation (AEC) refers to the echo cancellation method that prevents the talker from hearing an echo of his or her own voice.
The sources of coupling of the speaker to the microphone may include various paths, as follows:
-
Direct path between the speaker and the microphone, if any;
-
Reflections from the surface where the VoIP phone is kept;
-
Reflections from the walls and other objects/people around the VoIP enabled phone;
-
Coupling of sound via the physical enclosure of the phone, in form of vibrations from the chassis; and
-
Loopback modes in hardware audio codecs at the audio front end of the phone.
2.2. Near-End Signal (Sin)
The signal recorded from a microphone which refers to the Near-End signal. It may mix the acoustic echo (AE) and the signal of the talker (NS). See Figure 2.
2.3. Far-End Signal (Rin)
The source signal of a speaker which refers to the Far-End signal. It may come from the audio file (smart speaker playing out music) or the Internet (someone talking from other device). See Figure 2.
2.4. Single Talk
Play some audio or speech from the speaker only (i.e., Sin = AE + NS, where NS =0). See Figure 2.
2.5. Double Talk
Play some audio or speech from the speaker and someone talks in front of the microphone too (i.e., Sin = AE + NS, where NS≠0). See Figure 2.

Figure 2: Relationship between Input Signal and Output Signal
3. AEC SPECIFICATION
The AEC specifications are as follows:
-
The distance between the speaker and the microphone should preferably be from 4 cm to 10 cm, the longer the better. If distance smaller than 4cm, the housing of device need to follow 4. REAL SET HOUSING ACOUSTIC TEST specifications
-
If audio files are used as the sound source, make sure that:
A. There is no aliasing in the audio files (see Figure 3), since it can affect the AEC result.
B. There is no signal clipping in the audio files (see Figure 4), since it can affect the AEC result.
C. Effective sample rate is 8 kHz, 16 kHz, 32 kHz and 48 kHz.
D. The Far-End signal is fed in AEC library when the echo appears (see Figure 5); if not, the result will be affected.
-
The delay time between AO and AI must be smaller than 0.064 sec when sample rate is 16 kHz (0.128 sec when sample rate is 8 kHz/0.032 sec when sample rate is 32 kHz/0.0213 sec when sample rate is 48 kHz), and the timing of Far-End signal should be earlier than that of Near-end signal (see Figure 6).
-
The sample rate of the microphone and the speaker must be the same.
-
The speaker should not be overloaded; otherwise the AEC performance will decrease as nonlinear increases.
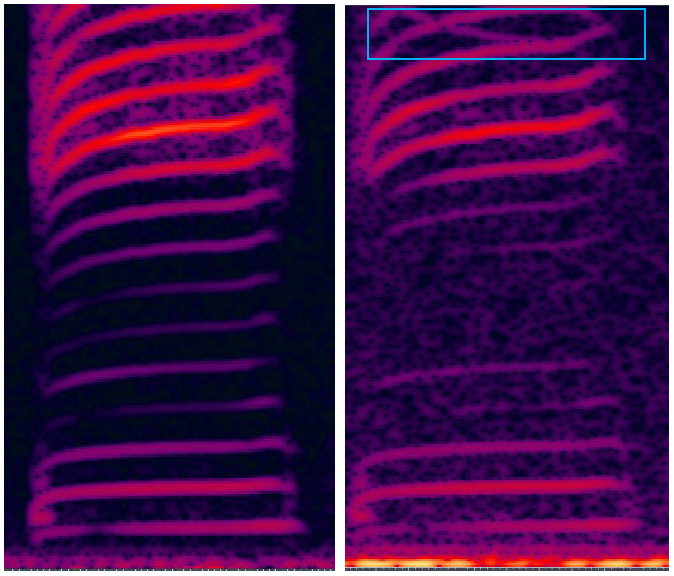
Figure 3: Signal without Aliasing (L) vs. Signal with Aliasing (R)
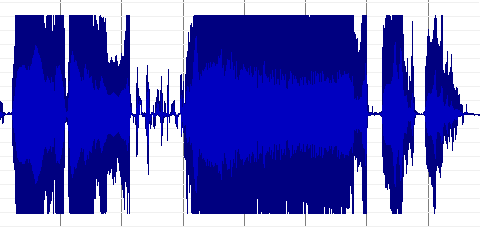
Figure 4: Instance of Signal Clipping

Figure 5: Far-End Signal Not Fed in AEC when Echo Appears
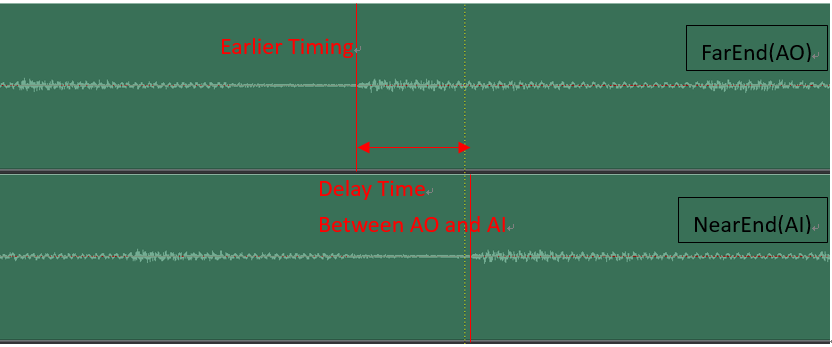
Figure 6: Delay Time between AI and AO, and Timing Relationship between Far-End Signal and Near-End Signal
4. REAL SET HOUSING ACOUSTIC TEST
4.1. Relationship between AEC Quality and Housing
Housing design determines to a large extent the performance of a hands-free device (e.g., a phone with speaker-phone mode). Voice quality can suffer significantly due to poorly designed device enclosure even when the world’s best AEC software is used. A few primary recommendations to ensure that hardware does not become the limiting factor in terms of AEC performance are listed in the following sections. As an example, wideband speech codec support makes sense only when the microphone and speaker are wideband. Similarly, if the microphone or the speaker induces any non-linearity in the echo path, then no linear model of the echo will be able to cancel the echo effectively; instead, this will cause distortion side effect in full-duplex condition.
4.1.1. Housing Design Recommendation
Speaker:
Rear Enclosure is a must. Do not use speaker only in product housing. See Figure 7.
A tight fitting junction between the front and the rear of the speaker enclosure will help reduce the sound propagation from the rear cavity to the front of the speaker. The speaker should be securely mounted at the interface between front and rear cavities as the speaker will serve as a part of the rear enclosure structure. Secure mounting of the speaker will also ensure rattling sounds are not created by the speaker and the enclosure. High density foam is often used when mounting speaker frames to enclosures to assist in creating a secure and tight fitting configuration. The hole of front cavity should occupy at least 20% of speaker area with a spacing from speaker frame of 1-2 mm.

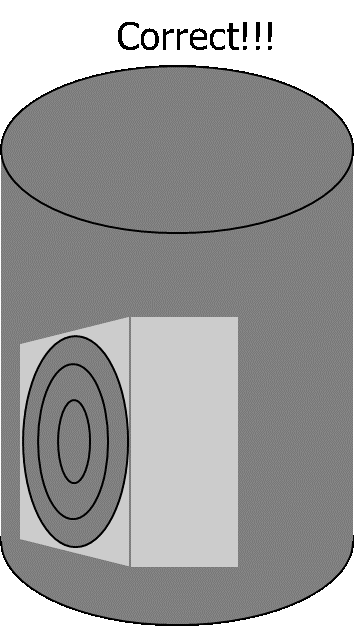

Figure 7: Using Proper Rear Enclosure for Speaker
Microphone:
Ensure that the microphone is housed in foam to increase ERL (Echo Return Loss) by reducing speaker-microphone coupling through direct path. Going one step ahead, one could also encase the microphone and surrounding foam in a separate housing within the enclosure. The microphone should line up the hole. See Figure 8.
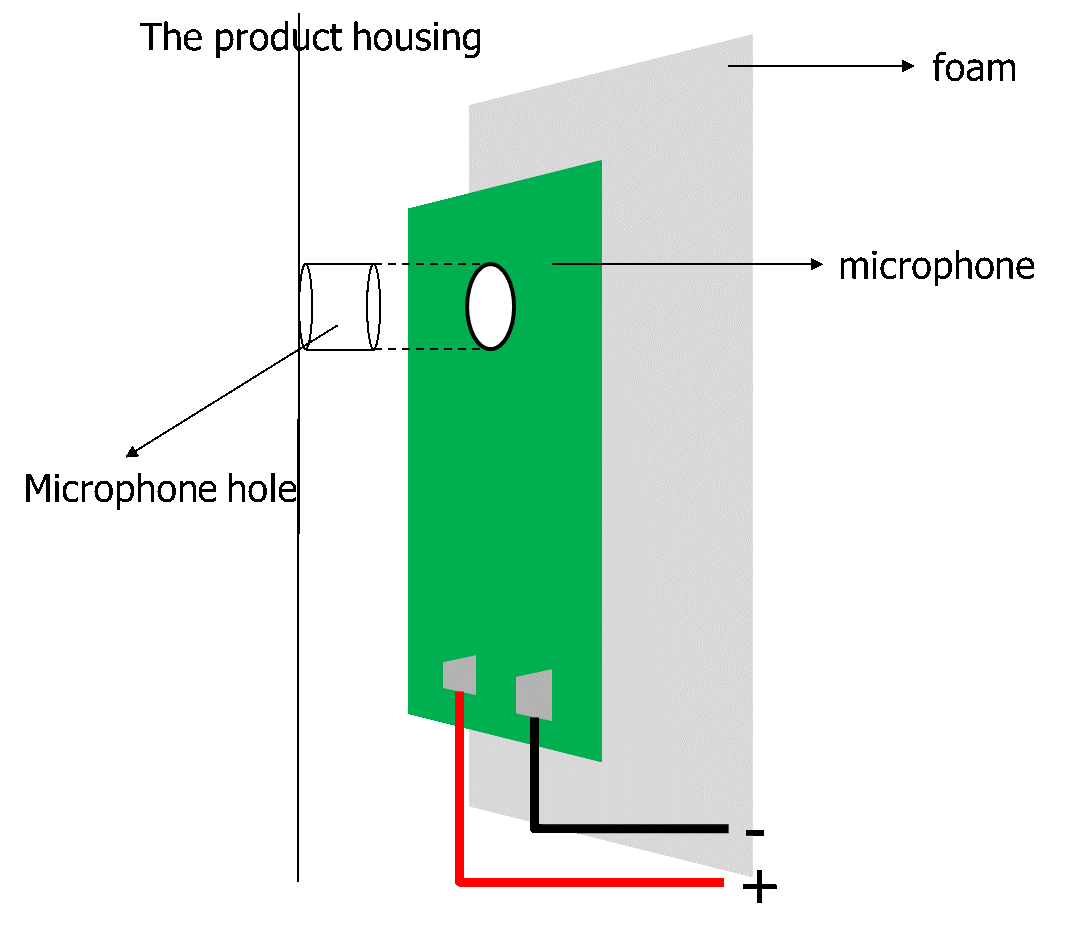
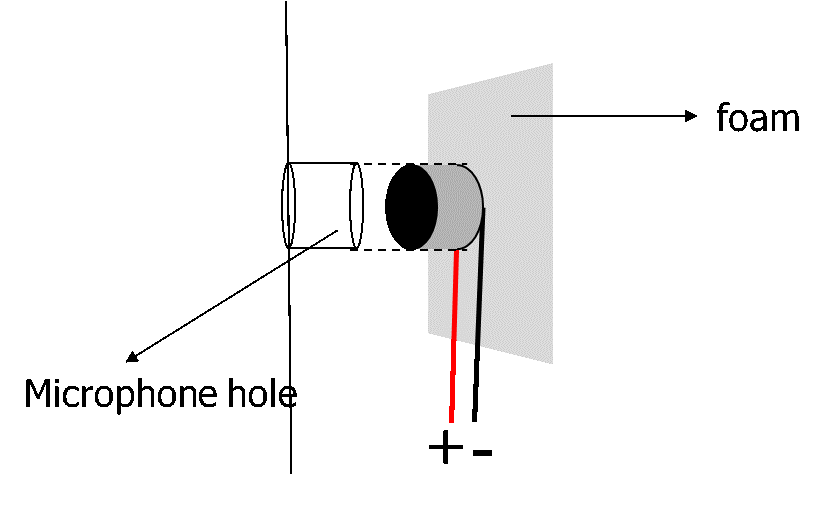
Figure 8: Lining up Microphone Hole and Ensuring Microphone is Housed in Foam
Position of microphone and speaker:
The distance between speaker and microphone should be as far as possible. If the distance is too close, the acoustic echo recorded from microphone will be clipping. To keep AEC performance under such circumstances, user should set the volume of speaker lower, but then the sound pressure level will not be loud enough, as illustrated in Figure 9.

Figure 9: Sufficient Distance between Speaker and Microphone Required to Avoid Microphone Data Clipping
4.2. Objective Acoustic Audio Test
After finishing design of the product housing, user needs to evaluate two objective values to verify whether the housing is good enough for audio quality, as follows:
-
Acoustic Isolation:
It can measure the isolation inside the housing between speaker and microphone
-
Speaker And Microphone Performance
Echo Return Loss (ERL): It can measure how much power of acoustic echo is attenuated from speaker to microphone.
Before measurement, user need to confirm the following parameters, please refer to Figure 10:
-
Distance between DUT and user = X cm
-
The user wants to hear Y dBSPL of the DUT SPK at this distance
-
The DUT MIC expects to receive Z dBSPL from the user
The subsequent measurement environment will be set according to these parameters.
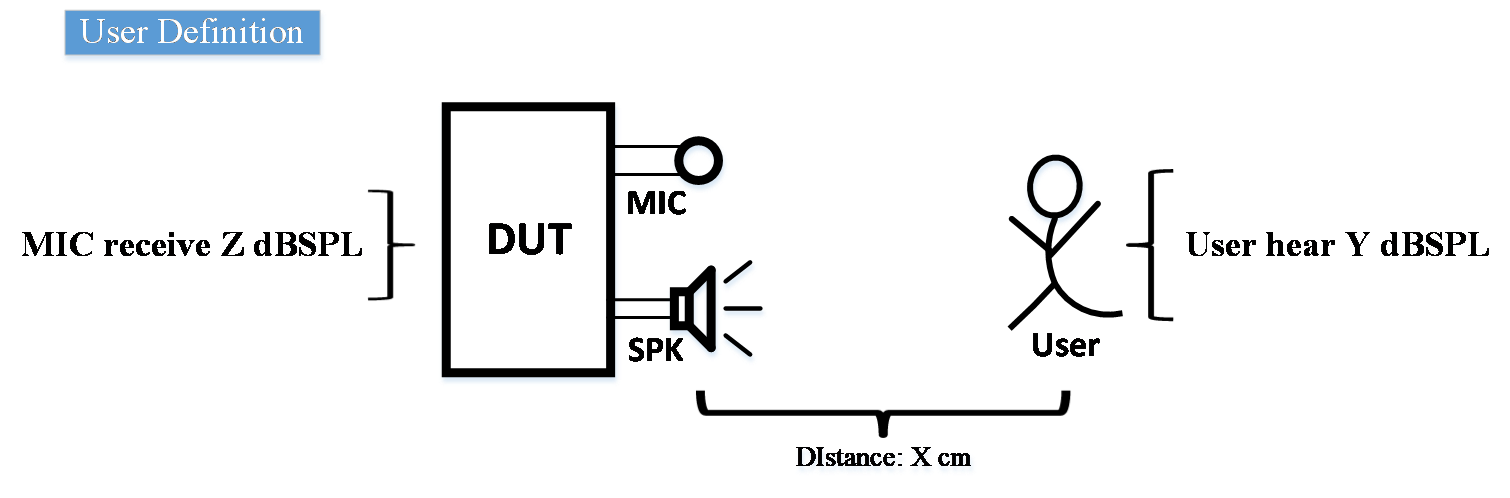
Figure 10: Acoustic test definition
Note:
-
Use IEEE female (-18dB AVGRMS) voice to check distance and gain
-
Volume calculation method
-
After finishing the recording, delete the silent part before and after
-
Frame the whole speech to calculate AVGRMS
-
-
Make sure recorded voice does not clipping at any frequency.
-
If recorded voice clipping
-
Redesign the gain value of each position
-
Redefine user distance and volume
-
Measure the performance of DUT microphone and DUT speaker
-
4.2.1. Microphone Acoustic Isolation
The testing environment noise cannot be over 40dbA. Please use decibel meter, set to FAST and use minimum scale. The SPK level and MIC level should ensure that the recording file does not go clipping when SPK plays out a normal speech.
User needs to evaluate three objective values to verify whether the housing is good enough for audio quality.
a) External Isolation
-
Disable Microphone and speaker effect (AEC、NR、AGC、EQ…)
-
Use reference MIC to measure the volume of the speaker at the position of the DUT. External SPK playback white noise. The volume must meets 80dBSPL, please refer to Figure 11.
-
Ref MIC use MIC calibrator to measure 1kHz 94dBSPL sine wave = X dBRMS
-
Expected Ref MIC measured 1kHz 80dBSPL = X -14 dBRMS
-
Modify the volume of the External SPK so that the ref MIC is measured to X-14 dBRMS
-
Finish the SPK volume calibration.
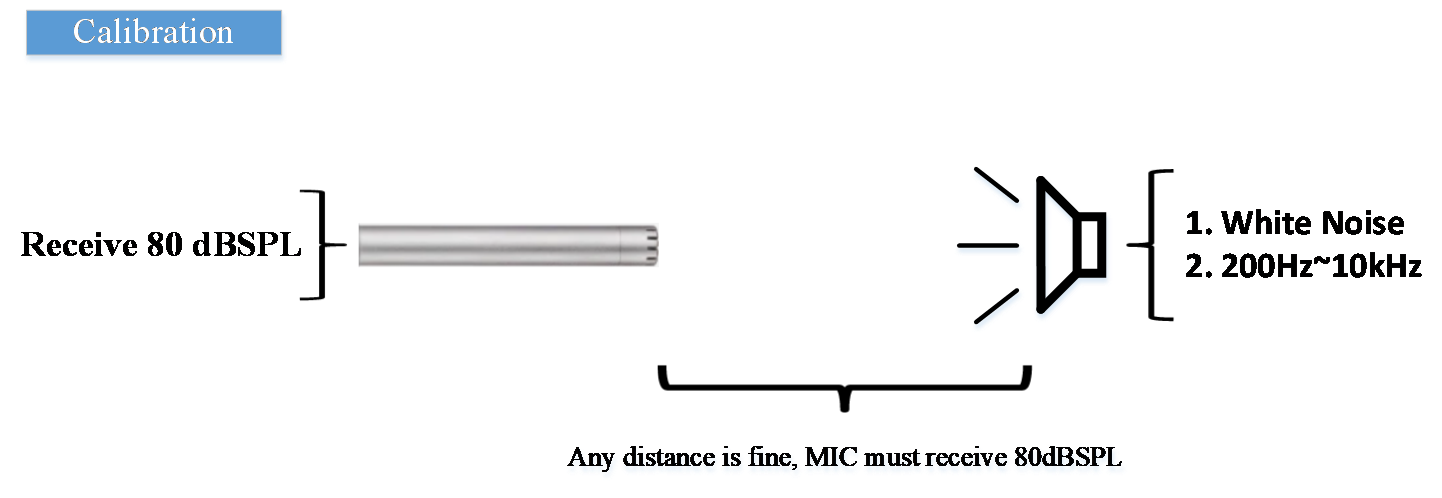
Figure 11: Method for calibration microphone.
-
-
DUT record the 80dBSPL white noise from external SPK = AVGRMS(X)
-
Use clay to seal the MIC hole then DUT record the 80dBSPL white noise from external SPK = AVGRMS(Y), please refer to Figure 12
-
Spec: AVGRMS(X)-AVGRMS(Y) > 20dBRMS

Figure 12: Method for measuring microphone isolation.
b) Internal Isolation
-
Disable Microphone and speaker effect (AEC、NR、AGC、EQ…)
-
Use a reference MIC which is 50cm from DUT to measure the volume of the DUT SPK. DUT SPK playback white noise. The volume must meets 80dBSPL, please refer to Figure 13.
-
Ref MIC use MIC calibrator to measure 1k 94dBSPL sine wave = X dBRMS
-
Expected Ref MIC measured 1k 80dBSPL = X -14 dBRMS
-
Therefore, Ref MIC will measure X -14dBRMS at a distance of 50cm from DUT
-
Modify DUT SPK gain to let Ref MIC measure X-14 dBRMS
-
Finish the SPK volume calibration.
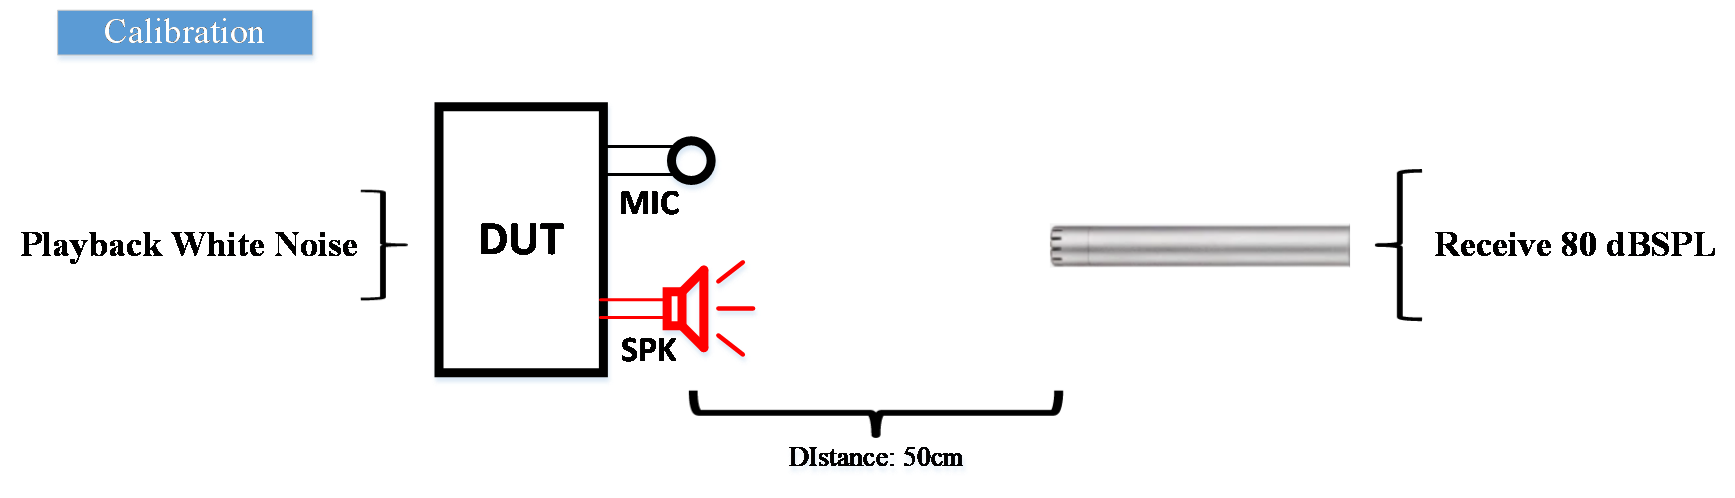
Figure 13: Method for calibration speaker
-
-
DUT record white noise from DUT SPK = AVGRMS(X), please refer to Figure 14
-
Use clay to seal the MIC hole then DUT record white noise from DUT SPK = AVGRMS(Y)
-
Spec: AVGRMS(X)-AVGRMS(Y)>20dBRMS

Figure 14: Method for measuring internal isolation
4.2.2. Speaker Performance
After the check of acoustic isolation, we must test the performance of the speaker in this mechanical design.
a) Frequency response
-
Disable effect (AEC、NR、AGC、EQ…)
-
Use SoundCheck Sequence “Triggered record Using WAV File.sqc”
-
DUT play IEEE female voice and adjust Tx audio gain that REF MIC record to Y dBSPL, finish DUT Tx audio gain setting
-
Generate -18dBFS 20Hz ~ 20kHz sweep sine by SoundCheck
-
Put the sweep sine into DUT and playback this .WAV with the set Tx audio gain
-
Use SoundCheck to record at the same time to check the FR
b) Total Harmonic Distortion + Noise
- After the FR test, you can directly see the result of THD+N
4.2.3. Microphone Performance
After the check of acoustic isolation, we must test the performance of the microphone in this mechanism design
a) Frequency response
-
Disable effect (AEC、NR、AGC、EQ…)
-
Set DUT Rx audio gain to 0
-
Use SoundCheck Sequence “Open Loop Microphone.sqc”
-
Playback IEEE female voice by SoundCheck Artificial Mouthand record by REF MIC (put on DUT MIC position)
-
Adjust SoundCheck Artificial Mouth playback volume, Ref MIC must measure Z dBSPL
-
Use this volume setting, playback -18dBFS 20Hz ~ 20kHz sine wave by SoundCheck Artificial Mouth and record by DUT MIC
-
Pull the .WAV from DUT and put it into SoundCheck
-
Use SoundCheck to analyze this .WAV and check the FR
b) Total Harmonic Distortion + Noise
- After the FR test, you can directly see the result of THD+N
NOTE:
After DUT recording, the audio file needs to be converted to PCM type .wav, Soundcheck can use this file type smoothly
4.2.4. Measurement of DBRMS
Download Audacity, and plug in stats.ny, as shown in Figure 15.

Figure 15: Audacity Plugging in stats.ny
Import a wave file, select analysis >> wav stats, and you will see a window as shown in Figure 16. Adjust the value to 10 sec.

Figure 16: Audacity Wave Stats
Next you will see a window like Figure 17:
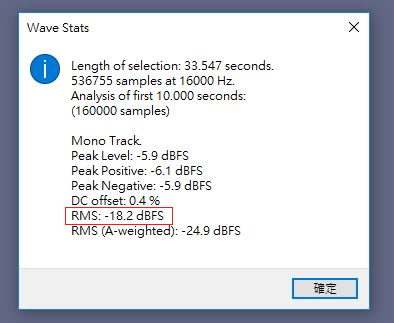
Figure 17: Element of RMS Showing the Average DBRMS
4.2.5. Measurement of Frequency Response
Import a wave file, and select a region you need to analyze, as shown in Figure 18. Select analysis >> Frequency graph, and you will see the frequency response, as shown in Figure 19. Then use Hann window and 128 point to analyze the frequency response.

Figure 18: Selecting the Region of Interest

Figure 19: Frequency Response Window
5. THINGS TO DO WHEN HOUSING DESIGN CANNOT BE MODIFIED
If the housing design is not modified, the AEC performance will downgrade, with some side effects as shown in Figure 20.

Figure 20: Side Effect to Appear when Housing cannot be modified
NOTE: The two conditions (in red circle) are mutually exclusive.
If the far end talker and the near end talker talk at the same time, the far end talker will hear the echo when the suppression mode is set lower. On the other hand, if the suppression mode is set higher, the far end talker cannot hear the voice coming from the near end talker.
Because the root cause (arising from the housing) is not solved, some side effect will remain no matter what user tuning software is applied. In the sections below, we will give some recommendations about software tuning. Note, however, that side effect will still exist to a certain degree.
5.1.1. AEC Tuning
-
Set AO gain to 0 db, and AI gain to 0 db.
-
Repeat Step 4 in section 4.2.3 and get a wave file, Record5.wav.
-
Open the Recored5.wav file, as shown in Figure 21. You can see the digital level is still low.
-
Play out a speech wave (TestFile2.wav) file from speaker, and record it as Record_S.wav, as shown in Figure 22. You can see the digital level is still low. Adjust microphone gain higher, if necessary.
-
Adjust microphone gain 3db until the Record_S.wav goes clipping, and select a bigger microphone gain level that will not render Record_S.wav go clipping, as shown in Figure 23. If the housing is bad when the microphone gain or the speaker gain is very small, see Sections 5.1.2, 5.1.3 and 5.1.4.
-
After fixing the AO gain, AI gain and enabling some audio functions, if needed, the default AEC suppression mode setting will be as follows:
MI_U32 u32AecSupfreq[6] = {20,40,60,80,100,120};
MI_U32 u32AecSupIntensity[7] = {4,4,4,4,4,4,4};
Please test single talk first. If there are some residual echo after AEC, review the PCM wave, MI_AI_Dev0Chn0_16K_AecOut.wav, and check the frequency band of the residual echo. If the frequency of the residual echo is concentrated (as shown in Figure 24), adjust u32AecSupfreq and u32AecSupIntensity and go to Step 7. Otherwise, set u32AecSupIntensity[7] higher.
-
Calculate the u32AecSupfreq[6] corresponding to the residual echo frequency band according to the point number and the sampling rate. Then, turn up the u32AecSupIntensity parameters on the corresponding frequency band.
As displayed in Figure 24, the frequency band can be calculated in the following equation:
(residual echo frequency)/((sampling rate)/2)×point number=(26002800)/4000×128≈8390
Please apply AEC suppression mode as follows:
MI_U32 u32AecSupfreq[6] = {20, 40, 60, 83, 90, 120};
MI_U32 u32AecSupIntensity[7] = {4, 4, 4, 4, 8, 4, 4};
After the adjustment, the residual echo should be suppressed, as shown in Figure 25.
-
Test the double talk and repeat Steps 6 and 7.

Figure 21: Acoustic Echo when Playing out a Sweep Wave from Speaker
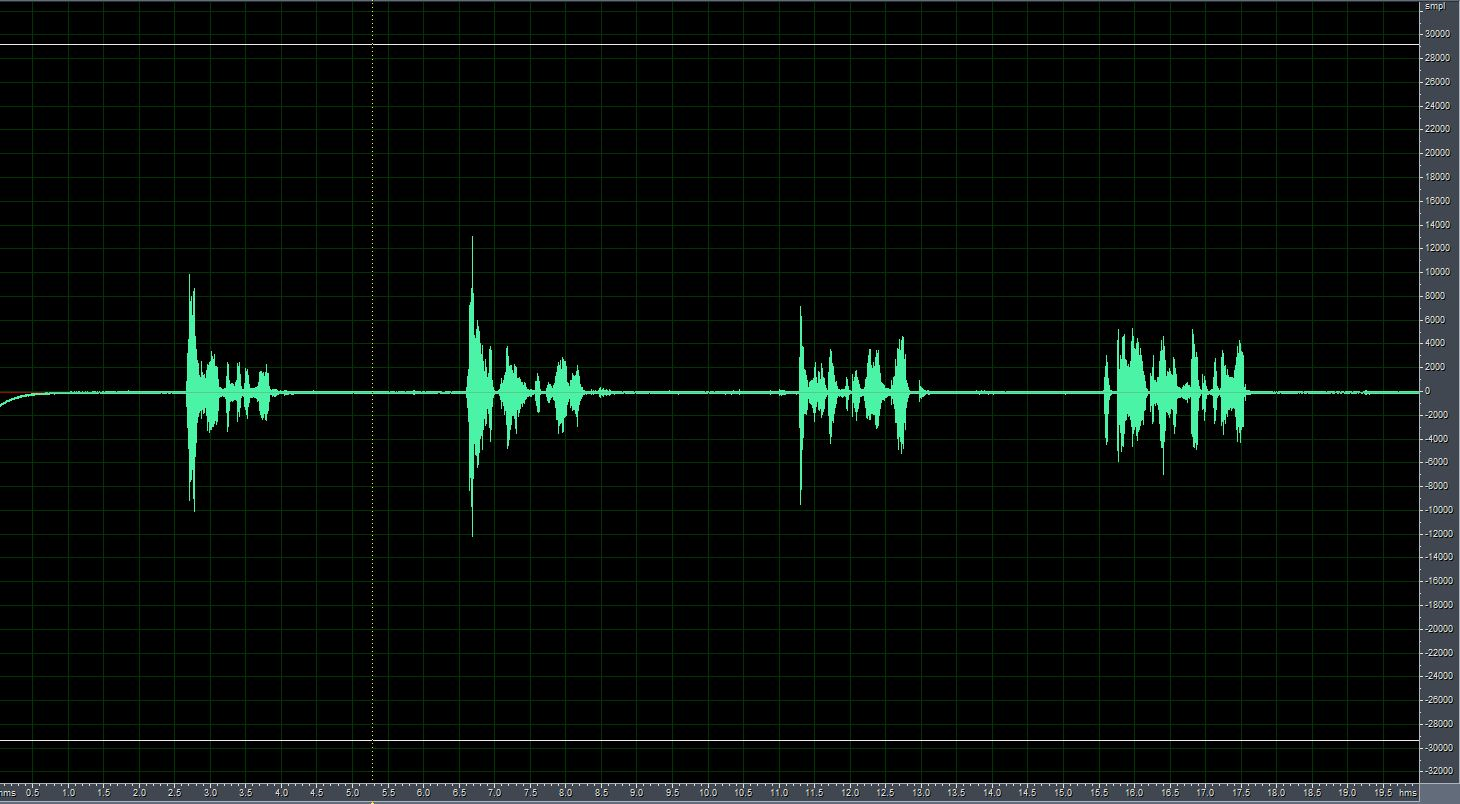
Figure 22: Microphone Level = 0 DB

Figure 23: Microphone Level = 24DB
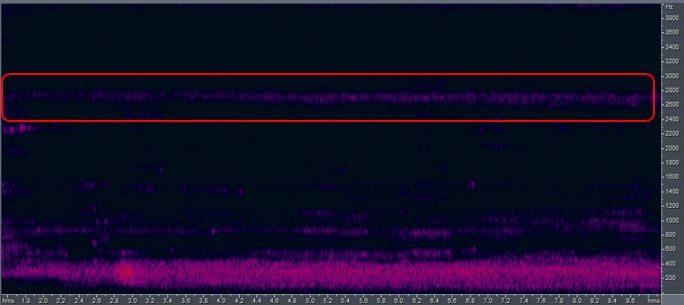
Figure 24: Frequency of Residual Echo Concentrated at 2600~2800 Hz

Figure 25: Result after Adjusting AEC Parameter
5.1.2. AEC Parameter Tuning – Case 1
If you have finished the SOP stated in Section 5.1.1, and the microphone gain is very small, that means the isolation of housing is very bad. Fixing the housing isolation problem is the best solution. If you cannot fix the housing problem, bear in mind that some side effect is unavoidable.
If you can turn down the speaker gain, turn down the speaker level first and repeat the process stated in Section 5.1.1 to find the new microphone gain. Otherwise, follow the SOP below:
-
Open the Record5.wav, shown in Figure 26. Then highlight the acoustic echo and transform it to frequency domain. See Figure 27.
-
Enable EQ in AO path, and use the EQ to suppress the power associated with the higher frequency response. For the EQ setting method, see Chapter 14.
-
Apply the EQ table in AO path, and repeat the SOP in Section 5.1.1.
-
If the microphone gain is still very small, please suppress more DB value in Step 2, and repeat Step 3.

Figure 26: Acoustic Echo Recorded from Microphone when Playing out Sweep

Figure 27: Acoustic Echo Frequency Response
5.1.3. AEC Parameter Tuning – Case 2
If using EQ cannot improve the AEC result, turn down the microphone gain and enable the AGC function and NR function in microphone. For the AGC tuning method, see Chapters 7 and 10. For the NR tuning method, see Chapter 11.
5.1.4. AEC Parameter Tuning – Case 3
If the microphone output is still small, let the acoustic echo go clipping, turn off the hardware loopback first and then set the suppression mode higher. Bear in mind the possible side effect when AEC is enabled. See Figure 28, 29.


Figure 28: Side Effect when Far-End and Near-End Go Active at the Same Time

Figure 29: Distortion in Double Talk Case, where Power of Near-End Speech may Decrease
6. AEC WAVE RESULT
6.1. AEC Result in Different Modes (4 and 15)

Figure 30: Speaker Digital Signal (Far-End)

Figure 31: Microphone Digital Signal (Near-End)
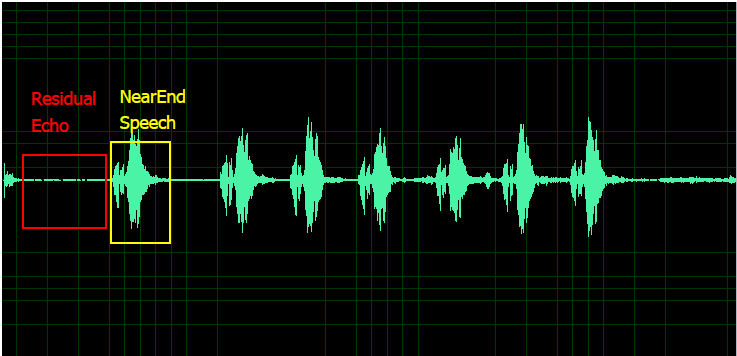
Figure 32: AEC Digital Output Signal (AecOut) with AEC Mode Set as 4
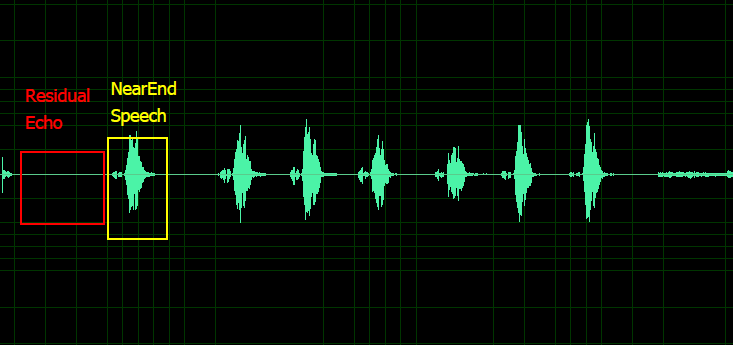
Figure 33: AEC Digital Output Signal (AecOut) with AEC Mode set as 15
AEC suppression mode determines how aggressive AEC is. Suppression mode 0 is the most conservative and suppression mode 25 is the most aggressive. The more aggressive the mode is, the fewer residual echoes and the more distortion will appear. Figures 30 to 33 show the results of AEC in suppression mode 0, 4 and 15. The recommended mode is 4.
7. DH TERMS AND DEFINITION
7.1. Lower Bin
Lower bin represents the lowest suppressed frequency bin, calculated according to the sampling rate and point number. If the frequency bin below Hz is not to be suppressed, calculate the lower bin according to the following equation:
x/((sampling rate)/2)×point number
Value range: [0, 128]. Adjustment step is 1. Recommended value is 19.
It is recommended that this value always be set above 19; if set to a value less than 19, it may suppress the speech frequency bin and cause normal speech distortion.
7.2. PTPR Threshold
Threshold of Peak-to-Threshold Power Ratio. It is one of the criteria for howling detection. The smaller the value is set, the easier it is to be detected as howling.
Value range: [0, 80]. Adjustment step is 1. Recommended value is 0.
7.3. PAPR Threshold
Threshold of Peak-to-Average Power Ratio. It is one of the criteria for howling detection. The smaller the value is set, the easier it is to be detected as howling.
Value range: [0, 80]. Adjustment step is 1. Recommended value is 10.
7.4. PHPR Threshold
Threshold of Peak-to- Harmonics Power Ratio. It is one of the criteria for howling detection. The smaller the value is set, the easier it is to be detected as howling.
Value range: [0, 80]. Adjustment step is 1. Recommended value is 20.
7.5. Suppression Threshold
Threshold of total number of howling in the range. When the total number of howling in the range exceeds this value, it will also be suppressed. If this setting value is smaller, the degree of suppression around the howling frequency band will be stronger.
Value range: [0, 80]. Adjustment step is 1. Recommended value is 5.
7.6. Supbins
The total number of suppressed frequency bins in the frame. If it exceeds this set value, it will be detected as excessive howling frame. The smaller this setting value is, the easier it is to be detected as excessive howling frames. This value needs to be adjusted along with the threshold of PTPR, PAPR and PHPR. When the thresholds of PTPR, PAPR and PHPR are smaller, this value must be increased; otherwise, it is too easy to be detected as excessive frames of howling.
Value range: [0, 128]. Adjustment step is 1. Recommended value is 30.
7.7. Excess Supbins Frames
This is used as a criteria for detecting whether to lower the volume. When the continuous accumulation of excessive howling frames exceeds this value, the volume must be reduced to achieve better results. The smaller the value, the easier it is to reach the criteria that requires a lower volume. Be careful to set this value. If it is set too low, it will be too easy to switch the speaker to a low volume mode, making the overall volume less than expected. On the contrary, if the setting is too high, the howling cannot be completely suppressed.
Value range: [0, 100]. Adjustment step is 1. Recommended value is 30.
7.8. Within Supbins Frames
This is used as a criteria for detecting whether to resume the volume. When non-howling excessive frames continuously accumulate above this value, the volume can be adjusted back to the original setting. The smaller the value is set, the easier it is to reach the criteria of resuming the volume. Be careful to set this value. If it is set too low, it will be too easy to switch the speaker to original volume mode, making the overall volume unstable. On the contrary, if this value is set too high, it will keep the speaker at a low volume.
Value range: [0, 500]. Adjustment step is 1. Recommended value is 100.
8. DH DEFAULT PARAMETER CONFIGURATIONS
8.1. Default Parameter Table
Table 1: DH Default Parameter Table
| Module | Parameter | Default |
|---|---|---|
| DH | Lower Bin | 19 |
| PTPR Threshold | 0 | |
| PAPR Threshold | 10 | |
| PHPR Threshold | 20 | |
| Suppression Threshold | 5 | |
| Supbins | 30 | |
| Excess Supbins Frames | 30 | |
| Within Supbins Frames | 100 |
9. AGC TERMS AND DEFINITION
9.1. Compression Ratio Curve
The Compression Ratio Curve is the relation (ratio) between input power level (dBFS) and output power level (dBFS). The compression ratio compresses the dynamic range of audio. You can set up to five coordinate points on the relationship coordinates of input and output power level to determine the curve you want. These seven points which contain four turning points can determine four different slopes.
For example, if the compression ratio setting is as follows:
compression_ratio_input[7] = {-80, -60, -50,-40,-30,-12,0}
compression_ratio_output[7] = {-80, -45, -36, -27, -18, -9, -6}
As Figure 34 shows, the parameters represent that, when input is -80dBFS, the Target Level would be set to -80dBFS; and when input is -60dBFS, the Target Level would be set to -45dBFS, and so on.
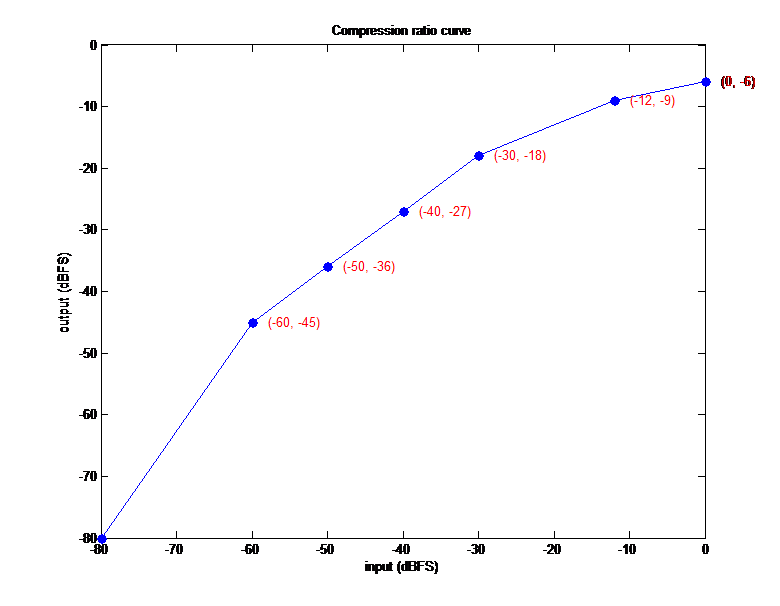
Figure 34: Compression Ratio Curve
If you don’t need six turning points, you can set the remaining parameters to zero:
compression_ratio_input[7] = {-80, -60, -30, 0,0,0,0};
compression_ratio_output[7] = {-60, -50, -10, -3, 0,0,0};
As Figure 35 shows, this set of parameters will have only three different slopes.
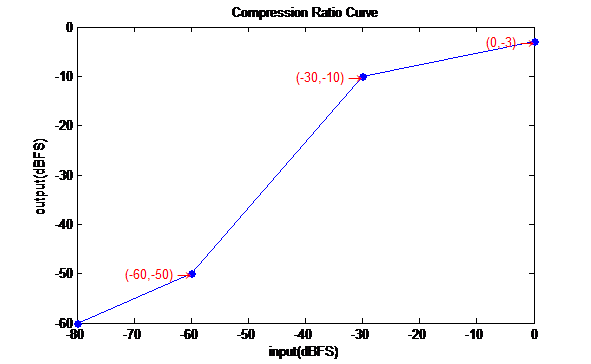
Figure 35: Compression Ration Curve with Three Different Slopes
Before setting the Compression Ratio Curve, you must check the input data power level and know how much gain (dB) you want to boost or cut off or which target power level you want to reach. Besides, the digital power level does not represent the loudness of the speaker. The real loudness should be measured by decibel meter, please refer to Figure 36.
We suggest that the maximum of compression output be set to -3dBFS to prevent data clipping. If the power level of output data does not meet you requirements, you can try boost more gain on low level input power. In other words, this means increasing the slope of the low power level curve.
For audio input, user should provide clear Compression Ratio Curve or information about how many average energies (dBFS) he or she wants to reach. If recording the wave data in real scenario is needed, please ask user to provide the following information:
-
Exact distance between speaker and mic (like 1m, 2m, 3m…).
-
Loudness of speaker (normal speech volume about 65-70dBA).
-
Whether speech or music is played. It is best to provide wav file, if possible. If user needs to play speech, but wav file is not available, please use IEEE_Female_mono_16_kHz or IEEE_269-2010_Male_mono_16_kHz_-18dBFS.
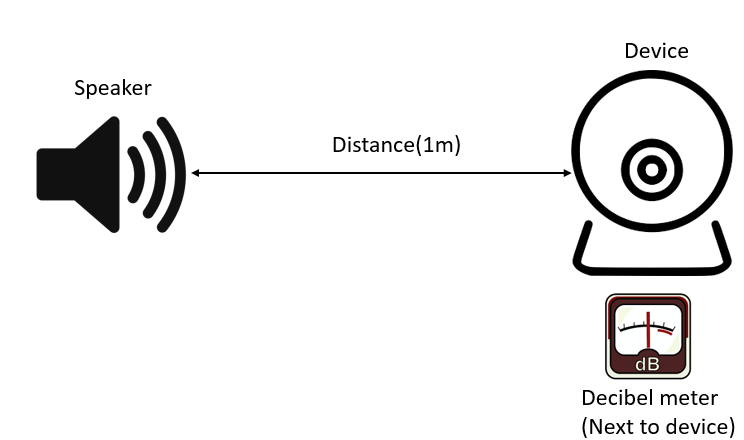
Figure 36: Audio Input Record Schematic Diagram
For audio output, user should provide clear Compression Ratio Curve or information about how many dB SPLs (measured by decibel meter) they want to reach. Real loudness is related not only to power level of digital signal but also to the hardware device. If the power level of digital data is close to 0dBFS, but the speaker still cannot reach the desired volume, please ask user to change their speaker or modify their loudness spec.
If data measured by decibel meter is required, please ask user to provide the following information, please refer to Figure 37:
-
Exact distance between device and decibel meter (like 1m, 2m, 3m…)
-
Desired loudness of devices at exact distance
-
Specified audio file for playing
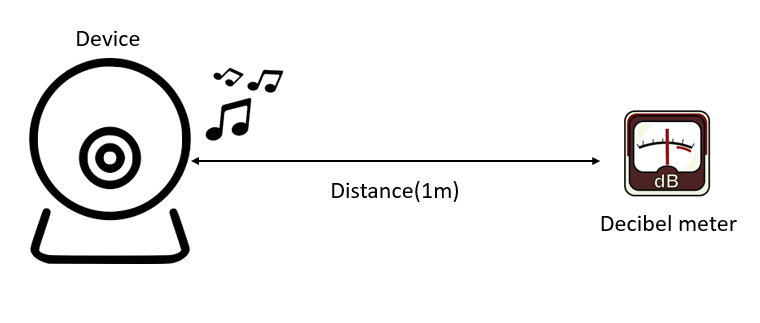
Figure 37: Audio Output Record Schematic Diagram
Besides, please fill out the AGC test result table. It can help us understand the current situation.
9.2. Drop gain threshold
Drop gain threshold refers to the value (dBFS) that sets the peak allowed output amplitude. After audio raw data applies digital gain, our AGC would estimate whether the peak would exceed this threshold. If the peak exceeds the threshold, the digital gain will be dropped down immediately to prevent clipping. The maximum value of gain dropping would be set by the parameter Drop Gain Max.
9.3. Noise Gate Threshold
Below the Noise Gate Threshold value, AGC will keep the gain of last frame to avoid the phenomenon of "breathing". If you measure the pure noise signal power level before setting the Noise Gate Threshold and set the proper noise gate threshold, AGC will have better results. The priority of noise gate is higher than that of Compression Ratio Curve. No matter how much Compression Ratio Curve is set, the signal will be judged as noise when the power level of input is under the Noise Gate Threshold. Adjustment step is 1dB. Value range: [-80dBFS, 0dBFS]. Recommended value is -60dBFS.
If user set noise gate threshold for positive value, the gain would be keep under corresponding noise gate value. For example, if user set noise gate as 60, the gain would be keep if the power of input data is under -60dBFS.
User can achieve the desired results by setting the specified curve too. As shown in Figure 38, if the power goes under the noise gate of -60dBFS, our AGC will keep the gain.
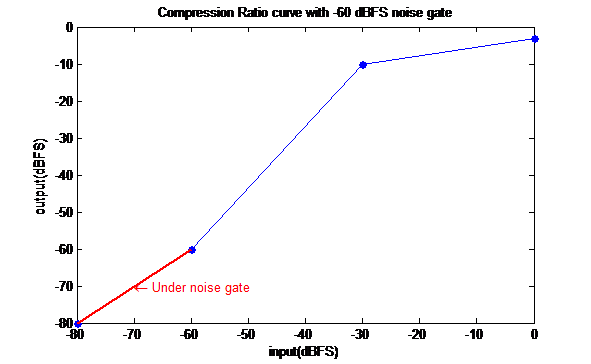
Figure 38: Compression Ratio Curve Setting with Gain Kept under Noise Gate
9.4. Attack Time
The minimum time between two gain decrements. Please refer to Figure 39 and Figure 40. Adjustment step is 4ms. It means gain will decrease 0.5dB between frame and frame. Recommended value is 1. If set to 2, the attack time would be 8ms and so on.
9.5. Release Time
The minimum time between two gain increments. Please refer to Figure 39 and Figure 40. Adjustment step is 4ms. It means gain will increase 0.5dB between frame and frame. Recommended value is 5. If set to 2, the attack time would be 8ms and so on.
NOTE: If the Release Time is set too short, the gain will increase fast. It may result in the higher probability of clipping points.
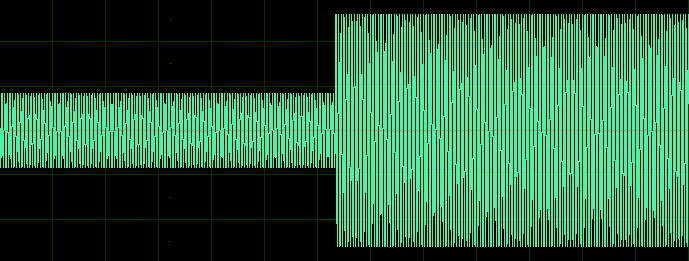
Figure 39: Origin Input Signal before AGC
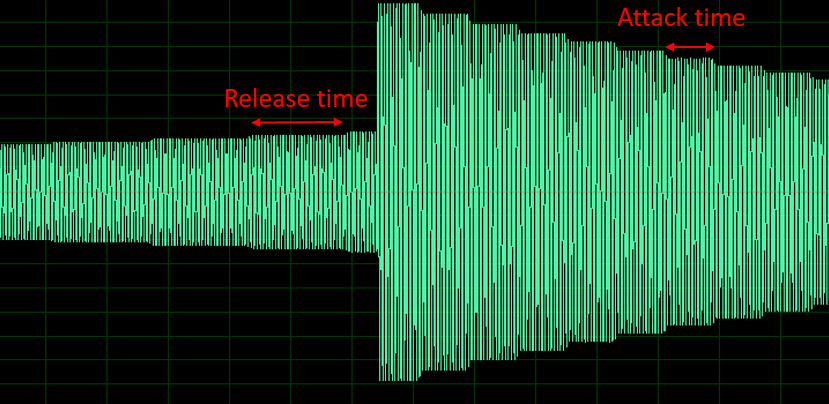
Figure 40: Output Signal after AGC, Showing the Relation between Attack Time and Release Time
9.6. Gain Info
The Gain Info defines the maximum, minimum and initial gain value of AGC. Adjustment step is 1dB.
Maximum gain: Value range: [0 dB, 60 dB]
Minimum gain: Value range: [-40 dB, 30 dB]
Initial gain: Value range: [-20 dB, 60 dB]
9.7. Drop Gain Max
Drop gain max refers to the maximum of dropping gain to prevent output from getting saturated. Because AGC would smooth data between frame and frame, it is uncertain whether every point is free of clipping. So we suggest that you employ the compression ratio and Release Time along with the Target Level, to make sure there is no data clipping. Adjustment step is 1dB. Value range: [0 dB, 60 dB]. Recommended value is 12 db.
NOTE: If the Drop Gain Max value is set too large, obvious pop noise may appear at the junction between frame and frame. On the other hand, if the Drop Gain Max value is set too small, the output may have a lot of clipping points. Therefore, you should tune this parameter to meet your own requirement.
9.8. Noise Gate Attenuation
Noise gate attenuation refers to the percentage of attenuation when input power is under the noise gate. When the power of input signal is under noise gate threshold, the signal will attenuate specified percentage immediately. Please refer to Figure 41.
Adjustment step is 1. Value range: [0, 100]. Recommended value is 0.
We recommend that you avoid using Noise Gate Attenuation to prevent the output signal sounding like interrupted connection. In addition, the tail and start tone of speech will be cut and as such make the speech unnatural.

Figure 41: Noise Gate Attenuation
9.9. Gain Step
The speed of applying gain is 0.5dB as a unit. If it is set to 1, then ±0.5dB is applied per frame according to requirements.
The higher the value is set, the faster the speed of increasing and decreasing the volume.
Adjustment step is 1. Value range: [1, 10]. Recommended value is 1.
9.10. Automatic gain control by frequency band
Our AGC support adjust gain by band when user set mode as 2. User can set different up to 3 band.
For example:
int freqBand[3] = {3000,6000,8000};
IaaApc_SetAgcFreqBand(handle, freqBand);
Then, user can set different compression ratio curve for each band as following example code:
int compressionRatioArrayLowInput[7] = {-80,-60,-40,-20,0,0,0};
int compressionRatioArrayLowOutput[7] = {-5,-5,-5,-5,-5,-5,-5};
int compressionRatioArrayMidInput[7] = {-80,-60,-40,-20,0,0,0};
int compressionRatioArrayMidOutput[7] = {-80,-60,-40,-20,0,0,0};
int compressionRatioArrayHighInput[7] = {-80,-60,-40,-20,0,0,0};
int compressionRatioArrayHighOutput[7] = {-80,-60,-40,-20,0,0,0};
IaaApc_SetLowFreqCompressionRatioCurve(handle, compressionRatioArrayLowInput, compressionRatioArrayLowOutput);
IaaApc_SetMidFreqCompressionRatioCurve(handle, compressionRatioArrayMidInput, compressionRatioArrayMidOutput);
IaaApc_SetHighFreqCompressionRatioCurve(handle, compressionRatioArrayHighInput, compressionRatioArrayHighOutput);
AGC would apply different input output relationship curve to different band.
10. AGC PROBLEM SOLUTION
10.1. Clipping
If the output signal data have too many clipping points, adjust the parameters Drop Gain Max, Compression Ratio Curve and Release Time, by increasing Drop Gain Max or lowering the slope of Compression Curve or increasing the Release Time.
Figure 42 below presents the results of different Drop Gain Max values. The upper one shows the result of Drop Gain Max 6dB, and the lower one the result of Drop Gain Max 12dB, wherein the Drop Gain Max measurement is too small, resulting in insufficient gain reduction.

Figure 42: Clipping Status with Different Drop Gain Value
Figure 43 presents the results of different Compression Ratio Curves. The upper one boosts less gain in range from -48dBFS to -25dBFS, which could avoid sudden increase of volume.

Figure 43: Clipping Status with Different Compression Ratio Curve
Figure 44 presents the results of different Release Times. An appropriate Release Time can effectively reduce the clipping points. However, if the Release Time is set too long, it will result in AGC failure.

Figure 44: Clipping Status with Different Release Time
10.2. AGC Not Working
If the output signal does not apply any gain after 0.5 sec, check Gain Info, Release Time, Attack Time and Compression Ratio Curve.
If the Gain Info is not properly set, it will seriously affect the applied AGC gain. For safety reasons, please set Gain Info in larger range.
If noise gate is set too high, the input signal will remain below the noise gate, and AGC will not apply gain on the output signal. Please check speech power level to see whether it is under the noise gate you set.
If you want to attenuate the signal below the noise gate by percentage, adjust the configuration (see Section 9.8). Note, however, that this parameter might cause unnatural voice at the end and start points. Therefore, when you set this parameter, the noise gate value should be taken into consideration carefully.
Once the setting is done, dump the input files, and send the output files to Sgs FAE.
10.3. Sound Too Small after AGC
If the output average power level does not reach the target dBFS you need, check the Compression Ratio Curve setting, Noise Gate and Release Time to see if the Release Time is set too long or the Compression Ratio Curve is set too gentle, and fix the corresponding problem.
11. NR TERMS AND DEFINITION
11.1. NR Mode
NR Mode; value range: [0, 1].
0: Default mode for speech
1: User setting mode
11.2. NR Intensity Frequency Band
NR supports 7 flexible frequency bands for different intensity. User can set the value in the range from 0 to 128. This value represents the frequency bin. Adjustment step is 1. For example, setting intensity band to {3,24,40,64,80,100} means NR will be separated into 7 segments, namely 0-3, 3-24, 24-40, 40-64, 64-80, 80-100, and 100-128. 0-3 represent frequencies from 0Hz to (sample rate/2)/128*3Hz, 3-24 represent frequencies from (sample rate/2)/128*3Hz to (sample rate/2)/128*24Hz, and so on.
11.3. NR Intensity
NR strength supports 7 different frequency bands; intensity 30 is the highest level of noise suppression, which comes with more detail losses/damage, though.
We suggest that you observe the spectral of input data, and judge which frequency band needs larger intensity. Together with the parameter NR Intensity Frequency Band, you can choose any frequency region desired.
11.4. NR Smooth Level
The signal frequency domain smooth level; the larger the value, the smoother the signal.
Value range: [0, 10]. Adjustment step is 1. Recommended value is 10.
11.5. NR Converge Speed
NR speed of noise adaptation; larger values would cause NR detect noise to be faster, at the expense of more detail losses/damage, however. Value range: [0, 1, 2]. Recommended value is 1.
11.6. NR Filter Mode
NR Filter Mode; value range: [0, 1, 2, 3, 4, 5].
0: Default Noise Estimation mode
1: Revised Noise Estimation mode
2: Aggressive Noise Estimation type 1 mode
3: Aggressive Noise Estimation type 2 mode
4: Fast Noise Estimation mode
5: Deep learning mode
[stationary noise] aggressiveness of NR filter mode: mode 2 ≅ mode 3 ≅ mode 1 > mode 4 > mode 0
Mode 0 to Mode 4 are based the conventional signal processing approaches. Mode 5 is based on Deep learning approach. Considering the computation cost in descending order are mode 5, mode1, mode 2, mode 3, mode 0 and mode 4. Recommended mode is mode 0. Under some scenario, such as impact noise and non-stationary noise, recommend mode is 5.
NOTE: If NR Filter Mode is 5, NR Converge Speed should be set as 2.
12. NR AND AGC DEFAULT PARAMETER CONFIGURATIONS
12.1. Default Parameter Table
Table 2: NR and AGC Default Parameter
| Module | Parameter | Scenario (Mode) | |
|---|---|---|---|
| Speech Mode | Music Mode | ||
| NR | Intensity band | {3,24,40,64,80,128}; | {3,24,40,64,80,128}; |
| Intensity | {20,20,20,20,20,20,20} | {20,20,20,20,20,20,20} | |
| Smooth Level | 10 | 10 | |
| Converge Speed | 1 | 1 | |
| Filter Mode | 0 | 0 | |
| AGC | Drop gain threshold | -3 | -3 |
| Attack Time | 1 | 1 | |
| Release Time | 5 | 5 | |
| Noise Gate | -60 | -60 | |
| Compression Ratio Input | {-77,-70,-40,-20,-15,-10,-5} | {-77,-70,-40,-20,-15,-10,-5} | |
| Compression Ratio Output | {-80,-60,-30,-15,-10,-5,-3} | {-80,-60,-30,-15,-10,-5,-3} | |
| Noise Gate Attenuation | 0 | 0 | |
| Drop Gain Max | 12 | 12 | |
| Maximum Gain | 20 | 20 | |
| Minimum Gain | -5 | -5 | |
| Initial Gain | 0 | 0 | |
| Gain Step | 1 | 1 | |
13. NR RESULT WAVE
13.1. NR Result in Different Intensities (15 and 30)
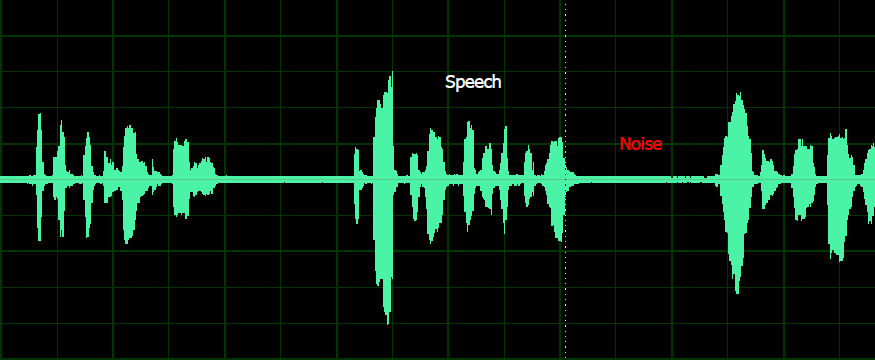
Figure 45: NR Result (Intensity: 15)

Figure 46: NR Result (Intensity: 30)
13.2. NR Result in Different Filter Mode (Intensity: 15)

Figure 47: NR Result in Different Filter Mode (Intensity: 15)
13.3. NR Results of Tunable Filter Mode 5
On the basis of Section 11.2, user can adjust different intensity in 7 flexible frequency band to reach the best listening experience in NR filter mode 5. Moreover, the missing words issue also get a great improvement as the following figures. The red rectangular marks the timestamp of breathy voice and interdental.
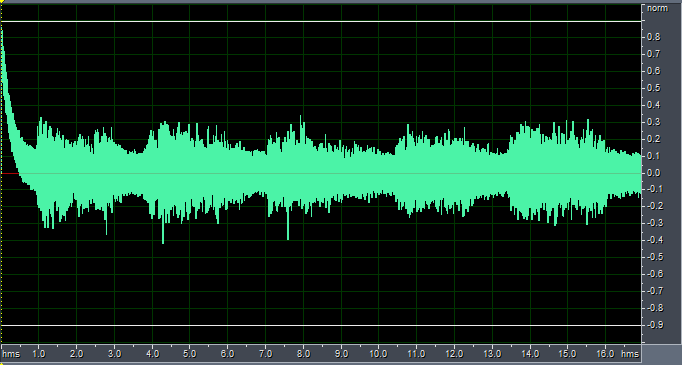
Figure 48: Unprocessed NR Result

Figure 49: NR Results of Tunable Filter Mode 5 (Intensity: 30)

Figure 50: NR Results of Tunable Filter Mode 5 (adjust intensity as 22 in range of 200Hz to 1kHz in order to keep the breathy voice and interdental)

Figure 51: APC Results with Tunable Filter Mode 5, EQ and AGC
14. EQ PAREMETER SETTING
Please set the array eq_gain_db[_EQ_BAND_NUM], which signifies the gain adjustment for the EQ frequency bands. We divide the frequency into 128 equal parts. Because we use brick filter in frequency domain, it would cause "ripple" according to our windowing function. Ripple will oscillate at the center frequency as shown in the following figure. Hence setting eq_gain_db value will affect the frequency response around center frequency as well.
 Figure 52: Frequency response of different eq_table_db index
The center frequency for every value in array eq_gain_db follow the formula below:
The 8 kHz frequency band is valid only when the working sampling rate (s32WorkSampleRate) is set to 16 kHz. The value range of each frequency band is [–100, +20] dB.
For example, if you need to decrease -10DB from 1560 Hz to 3000 Hz, then set the eq_gain_db array index, floor(\frac{1560}{62.5})=24 to ceil(\frac{3000}{62.5})=48 as -10 DB.