Linux System Debug SOP
REVISION HISTORY
| Revision No. | Description |
Date |
|---|---|---|
| 1.0 | 12/21/2023 |
Preface
This document is written for FAE and software development personnel, aimed at introducing how to conduct preliminary troubleshooting when customers encounter Linux system-related issues during the development process. Relevant information should be provided to RD for analysis only after confirming it is an SDK issue.
1. Memory Leak Issues
When OOM occurs during system operation, or when it is observed from /proc/meminfo that available or free memory continues to decrease, memory leak issues should be investigated first.
1.1 Determine if it is User or Kernel Memory Leak
The information printed by OOM is similar to meminfo information, and memory usage-related data can be obtained from the printed information.
OOM
If the active_anon and inactive_anon of OOM are relatively large, application layer memory leak may be suspected.
If the slab_reclaimable and slab_unreclaimable of OOM are relatively large, kernel memory leak may be suspected.
/proc/meminfo
If the Active (anon) and Inactive (anon) or AnonPages of /proc/meminfo are relatively large, application layer memory leak may be suspected.
If the SReclaimable and SUnreclaim of /proc/meminfo are relatively large, kernel memory leak may be suspected.
1.2 Application Layer Memory Leak
1.2.1 Application Does Not Explicitly Call malloc-like Interfaces
The user does not explicitly call malloc-like interfaces to request memory, but memory leak is caused by other interfaces, such as threads not being actively recycled after termination.
1.2.1.1 /proc/$pid/maps or pmap
In this case, you can check whether the size of 8192K anonymous pages in /proc/$pid/maps or pmap has increased. (8192 is the default stack size for glibc user threads, while uclibc uses 2044K. The reason it is not 1024K-aligned is because 4K is used as a guard page.)
Thread stack leak:
- Roughly calculate the number of all thread stacks of the current process:
pmap pid | grep 8192 | wc -l. If this number continues to increase, thread stack leak may exist. - However, if the app only has a few more thread stacks than at startup but does not continue to grow, and still has more thread stacks than at startup after exiting all threads, it may not be a thread stack leak, but could be glibc stack cache (default is 40M, i.e., 5 threads).
- Generally caused by threads exiting without
pthread_join()or not callingpthread_detach()before thread exit.
1.2.1.2 /proc/$pid/status
You can also check /proc/$pid/status to see if the Threads field has growth.
1.2.2 tcmalloc heap profile
If the app does not have exit logic and cannot use ASAN to scan for memory leaks, consider using tcmalloc.
The required libraries need to be downloaded from the release versions of gperftools and libunwind and extracted:
- gperftools
-
# Compile libunwind, the .so location is build/lib/libunwind.so.8
./configure --host=arm-linux-gnu CXX=arm-linux-gnueabihf-g++ CC=arm-linux-gnueabihf-gcc --enable-cxx-exceptions --disable-tests --prefix=$PWD/build
make install

# Compile gperftools, the .so location is build/lib/libtcmalloc.so.4.5.16
./configure --host=arm-linux-gnu CXX=arm-linux-gnueabihf-g++ CC=arm-linux-gnueabihf-gcc --prefix=$PWD/build \
CPPFLAGS="-I$PWD/../libunwind-1.8.1/build/include" \
CFLAGS="-I$PWD/../libunwind-1.8.1/build/include" \
LDFLAGS="-L$PWD/../libunwind-1.8.1/build/lib" LIBS="-lunwind"
make install
The app needs to be compiled with -g. The app on the board can be stripped, but the
.ARM.exidxsection must be retained, which can be confirmed viaarm-linux-gnueabihf-readelf -S app. The app used for local pprof analysis must have-g(because backtrace unwind only needs the.ARM.exidxsection to get function addresses, but pprof needs debug info to print line numbers when analyzing results).Also, if using uclibc, in addition to
-g, you need to add-funwind-tables, because the uclibc toolchain does not seem to generate the.ARM.exidxsection by default.
Notes for compiling app:
- The app needs to be compiled with
-g, because pprof analysis results need to view line numbers. - The app on the board can be stripped, but the
.ARM.exidxsection needs to be reserved, which can be confirmed byarm-linux-gnueabihf-readelf -S app. - The app used for pprof analysis locally must have
-g(because recording backtrace only requires function address information, but pprof analysis results need to print function names, requiring debug information). -
If using uclibc toolchain, in addition to
-g,-funwind-tablesalso needs to be added, because uclibc toolchain does not seem to generate.ARM.exidxby default.When running the app (remember to rename to libunwind.so.8), add the following environment variables:
First copy libunwind.so.8 and libtcmalloc.so.4.5.16 to the devicemkdir /mnt/mmc/profile
export HEAPPROFILESIGNAL=12 HEAPPROFILE=/mnt/mmc/profile/profile UNW_ARM_UNWIND_METHOD=4
You can also add HEAP_PROFILE_MMAP=true HEAP_PROFILE_MMAP_LOG=yes to capture app mmap information, but cannot capture thread stack mmap, because glibc calls __mmapexport LD_LIBRARY_PATH=/dir/to/libunwind.so.8 # Directory where libunwind.so.8 is located
LD_PRELOAD=/path/to/libtcmalloc.so.4.5.16 ./app
kill -12 pid at intervals to generate malloc usage at a specific moment in the /mnt/mmc/profile/ directory.
Analyze results on the host side (the app here needs to have -g and not be stripped):
pprof --lines --text --show_bytes app profile.0001.heap --lib_prefix=$PWD, if--show_bytesis not added, MB is displayed.- If the result of the first step only has addresses and no function names, you may need to copy the corresponding unstripped so to the host, for example
/config/lib/libxx.someansmkdir ./config/liband copy. -
The output of the first step mainly focuses on the first column, which is the number of bytes allocated but not freed by each function.
A more direct method is to compare 2 results: pprof --lines --text --show_bytes [app] profile.0002.heap --lib_prefix=$PWD --base=profile.0001.heap, if the value in the first column of a certain line increases significantly, it indicates that the function in the corresponding line may have a memory leak.
1.3. Kernel Memory Leak
1.3.1 slab memory
Commonly, check slab_reclaimable and slab_unreclaimable in OOM, and SReclaimable and SUnreclaim in meminfo, especially unreclaim memory. If these items consume too much memory, kernel's native slub debug mechanism can be enabled for debugging.
slub debug configuration options:
CONFIG_SLUB=y
CONFIG_SLUB_DEBUG=y
CONFIG_SLUB_DEBUG_ON=y
CONFIG_SLUB_STATS=y
# Identify which slab is leaking memory. The leaking one typically has continuously increasing active_objs.
cat /proc/slabinfo
slabinfo - version: 2.1
# name            <active_objs> <num_objs> <objsize> <objperslab> <pagesperslab> : tunables <limit> <batchcount> <sharedfactor> : slabdata <active_slabs> <num_slabs> <sharedavail>
mi_vif_internal        0     18    448   18    2 : tunables    0    0    0 : slabdata      1      1      0
mi_vif_internal        0     18    448   18    2 : tunables    0    0    0 : slabdata      1      1      0
mi_scl_internal        8     20   1600   20    8 : tunables    0    0    0 : slabdata      1      1      0
cmdq_pool              5     20    400   20    2 : tunables    0    0    0 : slabdata      1      1      0
mi_sys_ringpool        0      0    576   28    4 : tunables    0    0    0 : slabdata      0      0      0
mi_sys_bufhandl      520    576    512   16    2 : tunables    0    0    0 : slabdata     36     36      0
mi_sys_meta_buf        0      0   1152   28    8 : tunables    0    0    0 : slabdata      0      0      0
mi_sys_cust_all        0      0   1152   28    8 : tunables    0    0    0 : slabdata      0      0      0
g_miSysChunkCac      540    616    576   28    4 : tunables    0    0    0 : slabdata     22     22      0
g_miSysMmaAlloc    34396  34408   1408   23    8 : tunables    0    0    0 : slabdata   1496   1496      0

# xxx is the name above, e.g., g_miSysMmaAlloc
cat /sys/kernel/slab/xxx/alloc_calls
1.3.2 vmalloc memory
In meminfo, VmallocUsed can check the usage of memory allocated through vmalloc.
Although some kernel versions do not statistics this item, you can also view related memory usage through the following method:
cat /proc/vmallocinfo
Note: Mainly compare the number of pages allocated in vmallocinfo, where the vmap page allocation count can be ignored.
1.3.3 Memory Allocated via CamOs API
emory allocated via CamOs API may be the slab memory mentioned above, or memory allocated via vmalloc.
For this part of memory usage, the mechanism for monitoring CAM OS API allocated memory can be used.
ethod to enable the mechanism:
-
Enable macro CONFIG_TRACE_CAM_OS_MEM in kernel
-
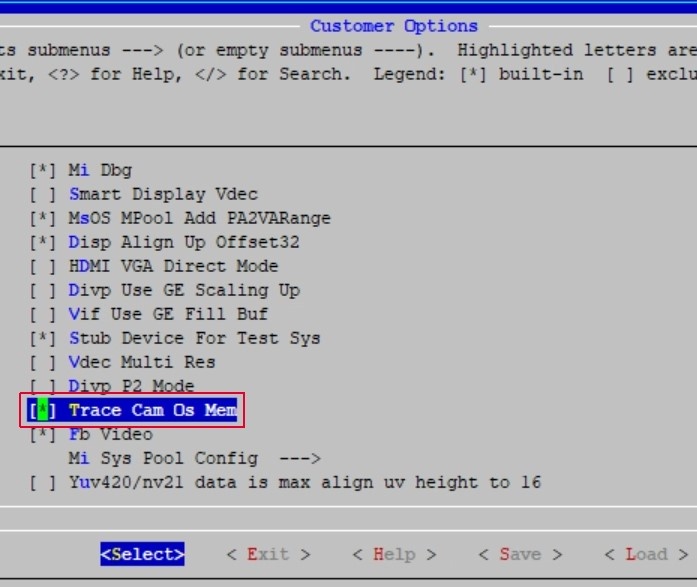
Enable TRACE_CAM_OS_MEM function through Alkaid's menuconfig option, execute make menuconfig in the project path, option path: Customer_Options → Trace Cam Os Mem, as shown in the figure:
This feature will record trace information in the following APIs:
CamOsMemAlloc
CamOsMemAllocAtomic
CamOsMemCalloc
CamOsMemCallocAtomic
CamOsMemCacheAlloc
CamOsMemCacheAllocAtomic
CamOsContiguousMemAlloc
If enabled successfully, there will be two proc entries: mem_filter and mem_stat under /proc/mi_modules/common on the platform.
cat /proc/mi_modules/common/mem_filter: View the modules that can be monitored.echo trace 5 > /proc/mi_modules/common/mem_filter: Select the module of interest to monitor memory consumption, e.g., selecting module MI_SYS with index 5.echo trace 40 > /proc/mi_modules/common/mem_filter: Setting a value greater than 39 allows viewing memory monitoring information for all modules, e.g., setting 40.-
echo showall 1 > /proc/mi_modules/common/mem_filter: Locate where modules call CAM OS API to allocate memory.Information Entry Meaning ModuleName The monitored module TotalSize The memory size allocated by the corresponding module TraceInfo The kernel memory size consumed for each record, which is the memory consumed by this feature TotalCount The total number of records in this monitoring session TraceCost The memory consumed by this feature in this monitoring session, equal to TraceInfo multiplied by TotalCount HighTotal The peak total memory allocated by all modules in this session CamTotal The total memory allocated by all modules in this session
If you need to view the function information for memory allocation by all modules, you can use the following commands:
    echo trace 10 > /proc/mi_modules/common/mem_filter
    echo showall 1 > /proc/mi_modules/common/mem_filter

    # 23 indicates that 1 identical API allocation with the same size is omitted in between.
    cat /proc/mi_modules/common/mem_stat
    --------------------------- CamOsMemory Usage state ---------------------------
    Function Caller                                                         Ptr             BytesReq
    --------------------------------------------------------------------------------
    [kernel]:
    _CamProcCreateEntryNode+0x6f/0x12a                                      c2199a00        38
    ...(23)
    0xbfdc907f                                                              c20a0200        d0
    ...(1)
    _CamProcCreateEntryNode+0x6f/0x12a                                      c1f79100        38
    .....


By comparing the results of `mem_stat` before and after, you can identify the location of the memory leak.
1.3.4 kmemleak tool
For kernel memory leak issues, kernel's native tool kmemleak can be used for analysis.
ethod to enable kmemleak:
Kernel hacking → Memory Debugging → Kernel memory leak detector
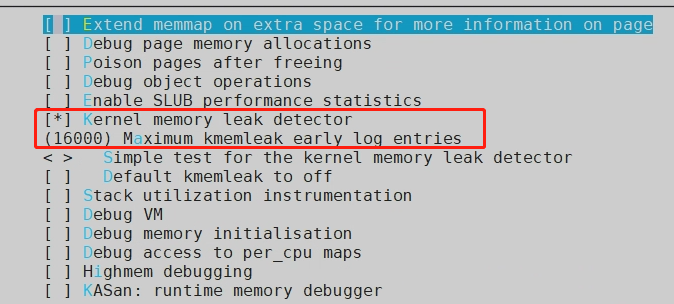
kmemleak enable corresponding configuration options:

1) Clear kmemleak history to record new data:
2) Enable kmemleak for memory leak detection scanning:
echo scan > /sys/kernel/debug/kmemleak

echo scan=n > /sys/kernel/debug/kmemleak  # Set automatic scanning every n seconds, default is 600s
3) View kmemleak memory leak detection results:
Running Steps:
1) echo clear > /sys/kernel/debug/kmemleak       // Clear cache

2) echo scan=10 > /sys/kernel/debug/kmemleak     // Start scanning, set scan interval to 10s
3) insmod kmemleak_test.ko

4) cat /sys/kernel/debug/kmemleak

unreferenced object 0xe1be4000 (size 4000):
  comm "insmod", pid 869, jiffies 4294948352 (age 31.890s)
  hex dump (first 32 bytes):
    0d 00 00 00 04 00 00 00 ff ff ff ff ad 00 00 00  ................
    01 00 00 00 02 00 00 00 ec 51 75 bf 98 01 00 00  .........Qu.....
  backtrace:
    [<c0092a8b>] __vmalloc_node+0x2f/0x38
    [<c0092ab7>] vmalloc+0x23/0x30
    [<bf75501f>] kmemleak_test+0x1e/0x54 [kmemleak_test]          // gdb can locate the vmalloc line
    [<bf75700d>] 0xbf75700d
    [<c00095bf>] do_one_initcall+0xcf/0x104
    [<c005ebc1>] do_init_module+0x39/0x12c
    [<c005ffc7>] load_module+0x12d1/0x13b6
    [<c0060159>] SyS_init_module+0xad/0xb8
    [<c000d2e1>] ret_fast_syscall+0x1/0x4c
    [<ffffffff>] 0xffffffff
Note: After kernel config enables CONFIG_TRACE_CAM_OS_MEM, kmemleak will not be able to track cam os api memory leaks, because all pointers allocated by camos will be added to the hash list. If there is a memory leak, the pointer of the leaked memory will still exist in the hash list. When kmemleak scans memory, it will also scan to this pointer, causing the kernel to mistakenly think there is no memory leak.
1.3.5 Using page_owner
When the above methods cannot find the root cause of kernel memleak, kernel's native page owner mechanism can be adopted, which records the owner of each requested page, and records the callstack of the owner requesting the page.
Configuration required to enable page_owner mechanism:
-
Add kernel configuration CONFIG_PAGE_OWNER=y
-
Add page_owner=on to bootargs parameter
After enabling the feature, you can see the following node in proc:
/sys/kernel/debug/page_owner
For the subsequent usage tutorial, you can refer to:
    Documentation/vm/page_owner.rst
    ...

    1) Build user-space helper::

    cd tools/vm
    make page_owner_sort

    2) Enable page owner: add "page_owner=on" to boot cmdline.

    3) Do the job what you want to debug

    4) Analyze information from page owner::

    cat /sys/kernel/debug/page_owner > page_owner_full.txt
    ./page_owner_sort page_owner_full.txt sorted_page_owner.txt

    See the result about who allocated each page
    in the ``sorted_page_owner.txt``.


Compile the page_owner_sort tool, then cat the node and sort the output. Then manually review the data.
Below is an example output from page_owner:
    /mnt/slab_diff/0804 # tail -n 20 ./sorted_page_owner2.txt

    1 times:
    Page allocated via order 8, mask 0x52dc0(GFP_KERNEL|__GFP_NOWARN|__GFP_NORETRY|__GFP_COMP|__GFP_ZERO), pid 2298, ts 7180405565150 ns, free_ts 7170863960659 ns
    get_page_from_freelist+0x1b5/0x402
    __alloc_pages_nodemask+0xc9/0x5de
    kmalloc_order+0x1f/0x44
    kvmalloc_node+0x39/0x88
    CamOsMemCalloc+0x35/0x44
    IqInit+0x11/0x8c [mi_isp]
    CameraIspAlgo_3A_IQ_Init+0x481/0x53e [mi_isp]
    CameraCreateIspInstance+0x29b/0x2f8 [mi_isp]
    MHalVpeCreateIspInstance+0xff/0x158 [mi_isp]
    MI_ISP_DRVCFG_CreateInstance+0xb9/0x19c [mi_isp]
    MI_ISP_IMPL_CreateChannel+0x619/0x6c4 [mi_isp]
    MI_ISP_IOCTL_CreateChannel+0x31/0x74 [mi_isp]
    MI_DEVICE_Ioctl+0xfd/0x1f0 [mi_common]
    vfs_ioctl+0x11/0x1c
    sys_ioctl+0x8b/0x4b2
    ret_fast_syscall+0x1/0x5c
The size corresponding to each order (page frame) is as follows:
    - order 0: 4KB
    - order 1: 8KB
    - order 2: 16KB
    - order 3: 32KB
    - order 4: 64KB
    - order 5: 128KB
    - order 6: 256KB
    - order 7: 512KB
    - order 8: 1MB
    - order 9: 2MB
This also corresponds one-to-one with the page frame counts in buddyinfo:
    cat /proc/buddyinfo
    Node 0, zone   Normal     28     22     15     14      5      7     10      5      5    128


Based on the remaining page frame count, we can calculate the LowFree size in meminfo. MemFree = HighFree + LowFree, so we can calculate the remaining memory.

Going back to the page_owner result above, we can clearly see: `Page allocated via order 8, mask 0x52dc0(GFP_KERNEL|__GFP_NOWARN|__GFP_NORETRY|__GFP_COMP|__GFP_ZERO), pid 2298, ts 7180405565150 ns, free_ts 7170863960659 ns`
Information about this page frame:
- order 8 allocated 1MB of memory
- The mask value
- The pid value
tsrepresents the timestamp when the page was allocated, i.e., the time point of page allocation.-
free_tsrepresents the timestamp of the last page release, i.e., the time point when the page was last freed.By comparing these two timestamps, you can calculate the elapsed time from allocation to the last release. This can be useful for analyzing page usage, memory reclamation, etc.
We can see that free_ts is less than ts, which means the memory was allocated but not freed. From the call stack, we can see that IqInit allocated 1MB of memory without freeing it.
2. High CPU Loading Issues
2.1 top
top can simply analyze the overall cpu loading and memory, confirming which thread or process has high cpu loading.
After inputting top and pressing 1, the loading of each cpu can be listed:
- us represents user, sy represents system, hi represents hard irq, si represents soft irq, st represents steal time (hypervisor).
- Through the top CPUx line, you can locate high cpu loading problems in non-thread context, such as si and hi being too high will also lead to untimely thread scheduling.
Mem: 74864K used, 1720804K free, 853776K shrd, 0K buff, 17924K cached
CPU0:  0.0% us  5.3% sy  0.0% ni 94.6% idle  0.0% io  0.0% hi  0.0% si  0.0% st
CPU1:  0.1% us  3.5% sy  0.0% ni 96.2% idle  0.0% io  0.0% hi  0.0% si  0.0% st
CPU2:  0.0% us  0.0% sy  0.0% ni  100% idle  0.0% io  0.0% hi  0.0% si  0.0% st
CPU3:  0.7% us  1.5% sy  0.0% ni 97.6% idle  0.0% io  0.0% hi  0.0% si  0.0% st
Load average: 14.05 14.05 14.01 1/108 1028
PID  PPID USER     STAT   VSZ %VSZ CPU %CPU COMMAND
996   993 root     S    58088  3.2   1  1.2 ./prog_vif_isp_scl_ut param_snr0_venc.ini
1003     2 root     DW       0  0.0   1  1.0 [isp0_P0_MAIN]
942     2 root     DW       0  0.0   1  0.1 [IspMidThreadWq]
997     2 root     DW       0  0.0   0  0.1 [vif0_P0_MAIN]
1028  1014 root     R     2432  0.1   2  0.1 top
1009     2 root     DW       0  0.0   2  0.0 [venc0_P0_MAIN]
937     2 root     DW       0  0.0   0  0.0 [IspDriverThread]
12     2 root     IW       0  0.0   3  0.0 [rcu_preempt]
2.2 perf
top can only locate the approximate problem location, but cannot locate the specific location causing high cpu loading.
perf and FlameGraph need to be used to locate the specific code location:
# Copy perf to the device and execute the following 2 commands, copy the generated perf.unfold out

# -a means --all-cpus, -g means capture kenrel and user; sleep 1 means exit capture after 1 second, you can increase this value to extend capture time

perf record -a -g sleep 1

perf script -i perf.data > perf.unfold

# Use captured perf data to generate flame graph

# https://github.com/brendangregg/FlameGraph.git, execute the command after entering the project directory

./stackcollapse-perf.pl ./perf.unfold > report.data && ./flamegraph.pl report.data > report.svg
If the captured part shows ? (unknown) or addresses, it may be necessary to compile the corresponding app binary and so with -g.
2.3 Instantaneous High CPU Loading Issues
Since FlameGraph displays cpu loading over a period of time, it cannot observe instantaneous high cpu loading.
Here flamescope is recommended, which only depends on python, so it can run on linux or windows:
# Capture method on the device is consistent

perf record -a -g sleep 1

perf script -i perf.data > perf.unfold

# Environment setup

git clone https://github.com/Netflix/flamescope

cd flamescope

# The flamescope of the master branch has problems, need to replace app/public with tag v0.2.0

git checkout -b v2.0.0 v2.0.0

cp app/public ..

git checkout master

cp -r ../public app

pip install -r requirements.txt

# Copy captured data to example for visualization

cp [path/to/perf.unfold] example/

python run.py
Open 127.0.0.1:5000 and then open perf.unfold, you can see a graph with x-axis in seconds and y-axis in milliseconds. Click any 2 points to open the flame graph within this period.
3. Deadlock Issues
3.1 Deadlock Concept
Deadlock refers to a state where multiple processes (threads) are blocked because they are waiting for resources occupied by other processes for a long time. When the waiting resources are not released, the deadlock will continue indefinitely. Once a deadlock occurs, the program itself cannot solve it and can only rely on external forces to restore the program's operation, such as restart, watchdog reset, etc.
3.2 Mutex Deadlock Analysis
ainly divided into D state deadlock and R state deadlock.
3.2.1 D State Deadlock Analysis
D state deadlock refers to the process waiting for I/O resources that cannot be satisfied, being in the TASK_UNINTERRUPTIBLE sleep state for a long time (system default configuration 120 seconds).
The specific problem can be located through the show_threads command of mi_sys.
Usage method:
ust be on the scene when the deadlock appears:
-
Create a new window, in this window:
cat /proc/kmsgThis step is very important, because capturing ksmg log is more complete than serial port log.
-
In another window:
echo show_threads > /proc/mi_modules/mi_sys/mi_sys0 -
Analyze the output of kmsg.
3.2.2 R State Deadlock Analysis
The process is in the TASK_RUNNING state for a long time (system default configuration 60 seconds) monopolizing the CPU without switching. Generally, this is because the process disables preemption or disables interrupts and then executes tasks for a long time, or an infinite loop. At this time, it often leads to inter-CPU mutex, and the entire system cannot schedule normally, causing the watchdog thread to fail to execute and unable to feed the dog, eventually leading to watchdog reset restart. This problem is mostly caused by improper handling of inter-CPU concurrent operations such as atomic operations and spinlock. The Lockdep deadlock detection tool introduced later detects R state deadlock.
3.3 Spinlock Deadlock Analysis
spinlock deadlock can be roughly divided into soft lockup and hard lockup.
soft lockup: Refers to the CPU running in kernel space and no task scheduling has occurred for more than a certain time.
hard lockup: Refers to the CPU not having any interrupt for more than a specified time.
For different lockups, there are different solutions and analysis methods.
3.3.1 soft lockup Analysis
For soft lockup, the Linux kernel's soft lockup detector can be used.
-
Principle
The soft lockup detector will start a watchdog thread for each CPU and set scheduling properties, only allowing execution on the corresponding CPU. The function of this thread is similar to a hardware watchdog, feeding the dog (updating the timestamp watchdog_touch_ts). If this thread is normally scheduled by the CPU, watchdog_touch_ts will be updated, thus not triggering a soft lockup alarm.
Checking whether the dog feeding timeout occurs is in the CPU arch timer interrupt handler. If the system is abnormal, such as: a certain thread uses preempt_disable() and does not call preempt_enable() for a long time, it will cause the dog feeding thread to not get CPU execution, leading to a timeout.
-
Usage Method
Kernel Config Option:
CONFIG_LOCKUP_DETECTOR=yAfter Kernel is recompiled, reflash and boot to reproduce the problem, capture log for analysis.
3.3.2 hard lockup Analysis
For hard lockup, there are currently no other good Features on native ARM Linux to locate the problem. You can locate the problem through the following Trace32 or Lockdep.
3.3.3 Trace32 Analysis
In addition to the above solutions, you can connect Trace32 to see the real context of each core, which is the most intuitive.
After connecting to Trace, input the command 'frame', which will pop up the stack information of core0 by default. Switch the core through the bottom right corner to view the context of the core you want to observe.
For more specific usage methods, refer to Trace32 training.
3.4 General Deadlock Analysis Methods
Whether it is spinlock or mutex (excluding semaphores), for scenarios that can be reproduced again, you can enable a deadlock detection feature of the Linux kernel "Lockdep". Enable Lockdep using the methods introduced later, then reproduce the problem, analyze the log to find the culprit causing the deadlock.
3.4.1 Lockdep Introduction
The Linux kernel provides the deadlock debugging module Lockdep, which tracks the state of each lock and the dependency between various locks. Through a series of verification rules, it ensures that the dependency between locks is correct.
Lockdep detects deadlocks including spinlock, rwlock, mutex, rwsem, incorrect release of locks, sleeping in atomic operations, and other error behaviors.
3.4.2 Lockdep Usage
Choose one of the following two methods, method 2 is recommended, which is more convenient and fast.
-
Enable by compiling Kernel alone
Enable the following options in menuconfig or defconfig:
CONFIG_DEBUG_LOCK_ALLOC=y CONFIG_PROVE_LOCKING=y CONFIG_LOCKDEP=y CONFIG_LOCK_STAT=y CONFIG_DEBUG_LOCKDEP=y CONFIG_TRACE_IRQFLAGS=y CONFIG_DEBUG_ATOMIC_SLEEP=y -
Enable by compiling entire Alkaid package
When compiling the entire image, add DEBUG=4, i.e.:
make image DEBUG=4 -jN
4. Memory Corruption Issues
Crash is the most common phenomenon of memory corruption issues (including accessing invalid pointers, assertion failures, printed variable values not meeting expectations, etc.)
4.1 sdk Alignment
If strange behavior is found when calling mi api (for example, the value printed in kernel is different from that obtained by user), first check whether the release sdk is aligned, including header files, ko, so, etc.
If it is confirmed that the problem still exists after alignment, confirm whether there are precompiled algorithm library so, etc. that separately use statically linked sdk .a. The confirmation method is as follows:
# MI_SYS_ChnInputPortGetBufPa is just an example, specifically it should be changed to the mi api that behaves strangely

# If the same api can be found in the so (T represents test section), it proves that libxxxx.so links to sdk's .a, and libxxxx.so needs to be compiled with the new sdk

arm-linux-gnueabihf-nm libtest.so | grep MI_SYS_ChnInputPortGetBufPa

0000000000002a20 T MI_SYS_ChnInputPortGetBuf

arm-linux-gnueabihf-nm libxxxx.so | grep MI_SYS_ChnInputPortGetBufPa

0000000000002a20 T MI_SYS_ChnInputPortGetBuf
4.2 asan (userspace)
Common memory corruption phenomena in userspace:
- SIGSEGV: null pointer, pointer used before initialization, memory out of bounds
- libc or very stable third-party libraries appear judgment failure leading to abort: may be memory out of bounds or used after free
-
No crash but certain variable values are abnormal: may be memory out of bounds or used after free
The most effective tool for locating memory corruption issues in userspace is asan.
4.2.1 Basic Usage of asan
Using asan to scan memory corruption issues in userspace:
- Need to enable 3 compilation options
-g -fsanitize=address -fno-omit-frame-pointerfor all compiled libraries and binary; you can also not add-fno-omit-frame-pointerbut need to retain.ARM.exidxsection when stripping. - Can strip when packaging, compilation must have -g and retain unstripped binary or so, otherwise addr2line cannot resolve file and line numbers.
- asan can also be statically linked, just add ld flags:
-static-libasan, so there is no need to addLD_PRELOADenvironment variable at runtime; if it is uclibc, you may also need to add ld flags:-lasan# main.c reference # int main(int argc, char *argv[]) # { # char *a = malloc(10); # free(a); # a[1] = 1; # return 0; # } arm-linux-gnueabihf-gcc -g -fsanitize=address -fno-omit-frame-pointer main.c # Copy /tools/toolchain/gcc-11.1.0-20250211-linaro-glibc-x86_64_arm-linux-gnueabihf/arm-linux-gnueabihf/lib/libasan.so.6.0.0 to the device, # and rename it to libasan.so.6; run the a.out compiled in the previous step on the device LD_PRELOAD=/path/to/libasan.so.6 ./a.out # asan operation result is as follows, what needs attention is the address of the stack at crash # ==803==ERROR: AddressSanitizer: heap-use-after-free on address 0xb41007b1 at pc 0x00010653 bp 0xbed15c80 sp 0xbed15c84 # WRITE of size 1 at 0xb41007b1 thread T0 # #0 0x10650 (/mnt/a.out+0x10650) # #1 0xb68b6bc4 in __libc_start_main (/lib/libc.so.6+0x17bc4) # The following a.out needs to be unstripped and compiled with -g arm-linux-gnueabihf-addr2line -e a.out 0x10650 main.c:8
4.2.2 oom After Enabling asan
asan will occupy 2 times the original memory (and 2 times the CPU overhead)
- If the app runs for a short time after enabling asan and then oom occurs, at this time it may be necessary to reduce mma to enable it; if it is still unable to enable asan due to insufficient memory, you can try to trim some functions; you can also try to enable swap.
-
If the app runs for a long time before oom occurs, you can set the environment variable
ASAN_OPTIONS=quarantine_size_mb=50to limit the size of the quarantine area (default is 250MB).ethod to enable swap when memory is insufficient:
-
Enable kernel config:
CONFIG_SWAP, sdk ko does not need to be recompiled. - Create swap file (can be executed on linux server):
dd if=/dev/zero of=./swap bs=1M count=250 && mkswap ./swap(adjusting the count value can adjust the swap size), copy the swap file to sd card or emmc. -
Enable swap on the device:
swapon /mnt/sd/swap, confirm thatSwapFreein/proc/meminfois greater than 0, proving that enabling is successful;echo 200 > /proc/sys/vm/swappinessadjust the tendency to use swap.Note that even after enabling swap, there may still be insufficient memory.
If the customer is arm64, but there is not enough memory to enable asan, you can consider using hwasan (memory usage will only increase by 30%-50%, and there is no quarantine area memory consumption, but the function is completely consistent with asan), the difference from asan usage:
-fsanitize=addresschanged to-fsanitize=hwaddress- Copy libasan.so changed to libhwasan.so.
4.2.3 Unable to Reproduce Problem After Enabling asan
If the problem cannot be reproduced after enabling asan, it is highly likely that precompiled libraries (.so or .a) need to be recompiled with asan, such as sdk or precompiled algorithm libraries recompiled with asan.
Compile sdk with asan: make DEBUG=256 image -j8
4.2.4 uclibc asan
Since uclibc cannot compile an ASAN version by default, libsanitizer have to be modified to adapt uclibc toolchain.
Usage method: Put libasan.a and libasan_preinit.o in the uclibc toolchain directory arm-linaro-linux-uclibcgnueabihf-9.1.0/arm-linaro-linux-uclibcgnueabihf/lib, and since it is statically linked, there is no need to add LD_PRELOAD parameter at runtime, other usage methods are the same.
4.3 kasan (kernel)
Kernel memory corruption phenomena:
- BUGON: native kernel code BUGON, or BUGON confirmed to be absolutely impossible, may be used after free or memory out of bounds.
- Variables become values that should not appear (may not panic): high probability is used after free, or may be memory out of bounds.
-
Read/write illegal addresses, may have the following prints:
Unable to handle kernel paging request at virtual addressaddress between user and kernel address ranges- The reason may be: used after free or memory out of bounds changed the value of the pointer, or used an uninitialized pointer.
kasan switch
CONFIG_KASAN, kernel and userspace are quite different. You cannot just use a single ko to compile with kasan. You must release the sdk with kasan. The compilation command ismake DEBUG=2 image -j8.
Several issues to note after enabling kasan:
- Insufficient flash space: can enable
CONFIG_KASAN_OUTLINE, generating a smaller binary; default isCONFIG_KASAN_INLINE=y, which is 2 times faster than outline. - If oom occurs, please refer to the asan handling method.
-
Through gdb to see file and line numbers need debug info, i.e.,
CONFIG_DEBUG_INFO=y.Here is a deliberately written used after free:
MI_S32 MI_SYS_Cmd_ProcShowThreads(/.../)
{ char * a = kmalloc(10, GFP_KERNEL); // ... kfree(a); a[0] = 1; return MI_SUCCESS; }
kasan log:
BUG: KASAN: use-after-free in MI_SYS_Cmd_ProcShowThreads+0x100/0x110 [mi_sys]

Write of size 1 at addr c3e34600 by task sh/1521

CPU: 0 PID: 1521 Comm: sh Tainted: P           O      5.10.117-android12-9-00500-gfdf36a84d0fb-dirty #1

Hardware name: SGS Soc (Flattened Device Tree)

[<c0214440>] (unwind_backtrace) from [<c020dd6c>] (show_stack+0x10/0x14)

[<c020dd6c>] (show_stack) from [<c122bdf8>] (dump_stack_lvl+0x80/0xac)

[<c122bdf8>] (dump_stack_lvl) from [<c04b9380>] (print_address_description+0x5c/0x2ec)

[<c04b9380>] (print_address_description) from [<c04b999c>] (kasan_report+0x16c/0x1a4)

[<c04b999c>] (kasan_report) from [<bf1149bc>] (MI_SYS_Cmd_ProcShowThreads+0x100/0x110 [mi_sys])

[<bf1149bc>] (MI_SYS_Cmd_ProcShowThreads [mi_sys]) from [<bf120260>] (MI_SYS_DEBUG_ProcOnExecCmd+0x80/0x98 [mi_sys])

[<bf120260>] (MI_SYS_DEBUG_ProcOnExecCmd [mi_sys]) from [<bf11af88>] (_MI_SYS_Proc_DevCommonWrite+0x1d8/0x17f8 [mi_sys])

[<bf11af88>] (_MI_SYS_Proc_DevCommonWrite [mi_sys]) from [<c0dda378>] (_CamProcWriteLinux+0x11c/0x180)

[<c0dda378>] (_CamProcWriteLinux) from [<c05b7e8c>] (proc_reg_write+0xc8/0x124)

[<c05b7e8c>] (proc_reg_write) from [<c04ea264>] (vfs_write+0x1c8/0x51c)

[<c04ea264>] (vfs_write) from [<c04ea744>] (ksys_write+0x8c/0xfc)

[<c04ea744>] (ksys_write) from [<c0200140>] (ret_fast_syscall+0x0/0x50)

Exception stack(0xe0057fa8 to 0xe0057ff0)

7fa0:                   0000000d a5e02064 00000001 a5e02064 0000000d ffffffff

7fc0: 0000000d a5e02064 00000080 00000004 a6399138 b69b694c 0149b31c b69b6955

7fe0: 00000000 b69b6918 0147fb5d a6379ce0

Allocated by task 1521:

__kasan_kmalloc+0xa0/0xac

MI_SYS_Cmd_ProcShowThreads+0x30/0x110 [mi_sys]

MI_SYS_DEBUG_ProcOnExecCmd+0x80/0x98 [mi_sys]

_MI_SYS_Proc_DevCommonWrite+0x1d8/0x17f8 [mi_sys]

_CamProcWriteLinux+0x11c/0x180

proc_reg_write+0xc8/0x124

vfs_write+0x1c8/0x51c

ksys_write+0x8c/0xfc

ret_fast_syscall+0x0/0x50

0xb69b6918

Freed by task 1521:

kasan_set_track+0x28/0x30

kasan_set_free_info+0x20/0x34

____kasan_slab_free+0xec/0x114

__kasan_slab_free+0x14/0x1c

kfree+0xa8/0x42c

MI_SYS_Cmd_ProcShowThreads+0xf8/0x110 [mi_sys]

MI_SYS_DEBUG_ProcOnExecCmd+0x80/0x98 [mi_sys]

_MI_SYS_Proc_DevCommonWrite+0x1d8/0x17f8 [mi_sys]

_CamProcWriteLinux+0x11c/0x180

proc_reg_write+0xc8/0x124

vfs_write+0x1c8/0x51c

ksys_write+0x8c/0xfc

ret_fast_syscall+0x0/0x50

0xb69b6918

# gdb view code location according to the stack information of the BUG line

arm-linux-gnueabihf-gdb interface/src/sys/mi_sys.ko

(gdb) b *(MI_SYS_Cmd_ProcShowThreads+0x100)

Breakpoint 1 at 0x4ab70: file xxxxx.c, line 575.
CONFIG_KASAN_SW_TAGS corresponds to user's hwasan, can only be used on 64-bit platforms. After enabling, it can reduce the memory usage of kasan.
4.4 HW Watchpoints (kernel)
If the problem cannot be reproduced after enabling kasan, and the corrupted variable is always the same, and the value of this variable rarely changes, you can consider using HW Watchpoints, so the scope of this method is very small.
If you need to add it to the ko in the sdk, you need to change register_wide_hw_breakpoint() in kernel/events/hw_breakpoint.c from gpl to EXPORT_SYMBOL
#include <linux/perf_event.h>

#include <linux/hw_breakpoint.h>

static int len = 0;

static void sample_hbp_handler(struct perf_event *bp, struct perf_sample_data *data, struct pt_regs *regs)

{
    pr_info("value is changed\n");
    dump_stack();
}

MI_S32 MI_SYS_Cmd_ProcShowThreads(/*...*/)

{
    struct perf_event_attr attr;

    hw_breakpoint_init(&attr);
    attr.bp_type = HW_BREAKPOINT_W | HW_BREAKPOINT_R;
    attr.bp_addr = (u32)&len;
    attr.bp_len = HW_BREAKPOINT_LEN_4;
    register_wide_hw_breakpoint(&attr, sample_hbp_handler, NULL);

    len = 1; // Here the write to the variable will trigger the interrupt to call sample_hbp_handler
    // ...
    return MI_SUCCESS;
}
log shows that the last function to write to memory is MI_SYS_Cmd_ProcShowThreads
Exception stack(0xc2461ca8 to 0xc2461cf0)

1ca0:                   00000000 2e58b000 401c8642 00000001 c09ea6c8 00000000

1cc0: bf0f3d58 bf0dee34 bf0b4f8c 00000000 00000001 c2461d9c c2461cc0 c2461cf8

1ce0: c01093c0 bf0b502c 60000013 ffffffff

r7:c2461cdc r6:ffffffff r5:60000013 r4:bf0b502c

[<bf0b4f8c>] (MI_SYS_Cmd_ProcShowThreads [mi_sys]) from [<bf0bbac8>] (MI_SYS_DEBUG_ProcOnExecCmd+0x74/0x90 [mi_sys])

r6:c2461e0c r5:c2461da8 r4:00000010

[<bf0bba54>] (MI_SYS_DEBUG_ProcOnExecCmd [mi_sys]) from [<bf0bb0b8>] (_MI_SYS_Proc_DevCommonWrite+0x21c/0x2bc [mi_sys])

r10:c35cbacc r9:00000000 r8:c2461e0c r7:00000000 r6:bf0bba54 r5:bf0f3db8

r4:00000001

[<bf0bae9c>] (_MI_SYS_Proc_DevCommonWrite [mi_sys]) from [<c058367c>] (_CamProcWriteLinux+0xac/0x118)

r10:00000000 r9:c2461f58 r8:0000000d r7:000d2598 r6:c19b2cec r5:c35cbac0

r4:0000000d

[<c05835d0>] (_CamProcWriteLinux) from [<c01e3898>] (proc_reg_write+0x98/0xa8)

r7:000d2598 r6:c1d34500 r5:c05835d0 r4:c1ba0e00

[<c01e3800>] (proc_reg_write) from [<c0167f84>] (vfs_write+0xc0/0x1b0)

r9:c01e3800 r8:000d2598 r7:c09ea6c8 r6:c2461f58 r5:c1d34500 r4:0000000d

[<c0167ec4>] (vfs_write) from [<c01681cc>] (ksys_write+0x78/0xc4)

r9:0000000d r8:c2461f64 r7:c09ea6c8 r6:000d2598 r5:c2461f58 r4:c1d34500

[<c0168154>] (ksys_write) from [<c0168230>] (sys_write+0x18/0x1c)

r9:c2460000 r8:c0008664 r7:00000004 r6:000d2598 r5:b6fce0c0 r4:000c5ea0

[<c0168218>] (sys_write) from [<c0008420>] (ret_fast_syscall+0x0/0x50)
4.5 Dump Kernel Image
If the kernel panic position is different every time, and often it is panic of native kernel code, you can suspect whether it is caused by ddr instability.
By dumping the .text section of the kernel, you can confirm whether ddr is unstable:
- Open System.map in the kernel directory, find
__start_rodataand_text, get the length of the .text sectionsize = __start_rodata - _text. cat /proc/iomemto get the start address of the .text section, but dumping needs the MIU address, so you need to subtract the start address of System RAM, i.e.,addr = kernel-code-start - system-ram-start.- Close the serial port (input 11111 on the serial port), open tv tool, and execute the operation shown in the figure below.
- Export the .text section of vmlinux:
arm-linux-gnueabihf-objcopy -j .text -O binary vmlinux k_text.bin. -
Compare the file exported from RAM and the .text exported from vmlinux. It is normal that many small binary segments are different (caused by static key). If a large segment appears different, you can suspect the stability of ddr.
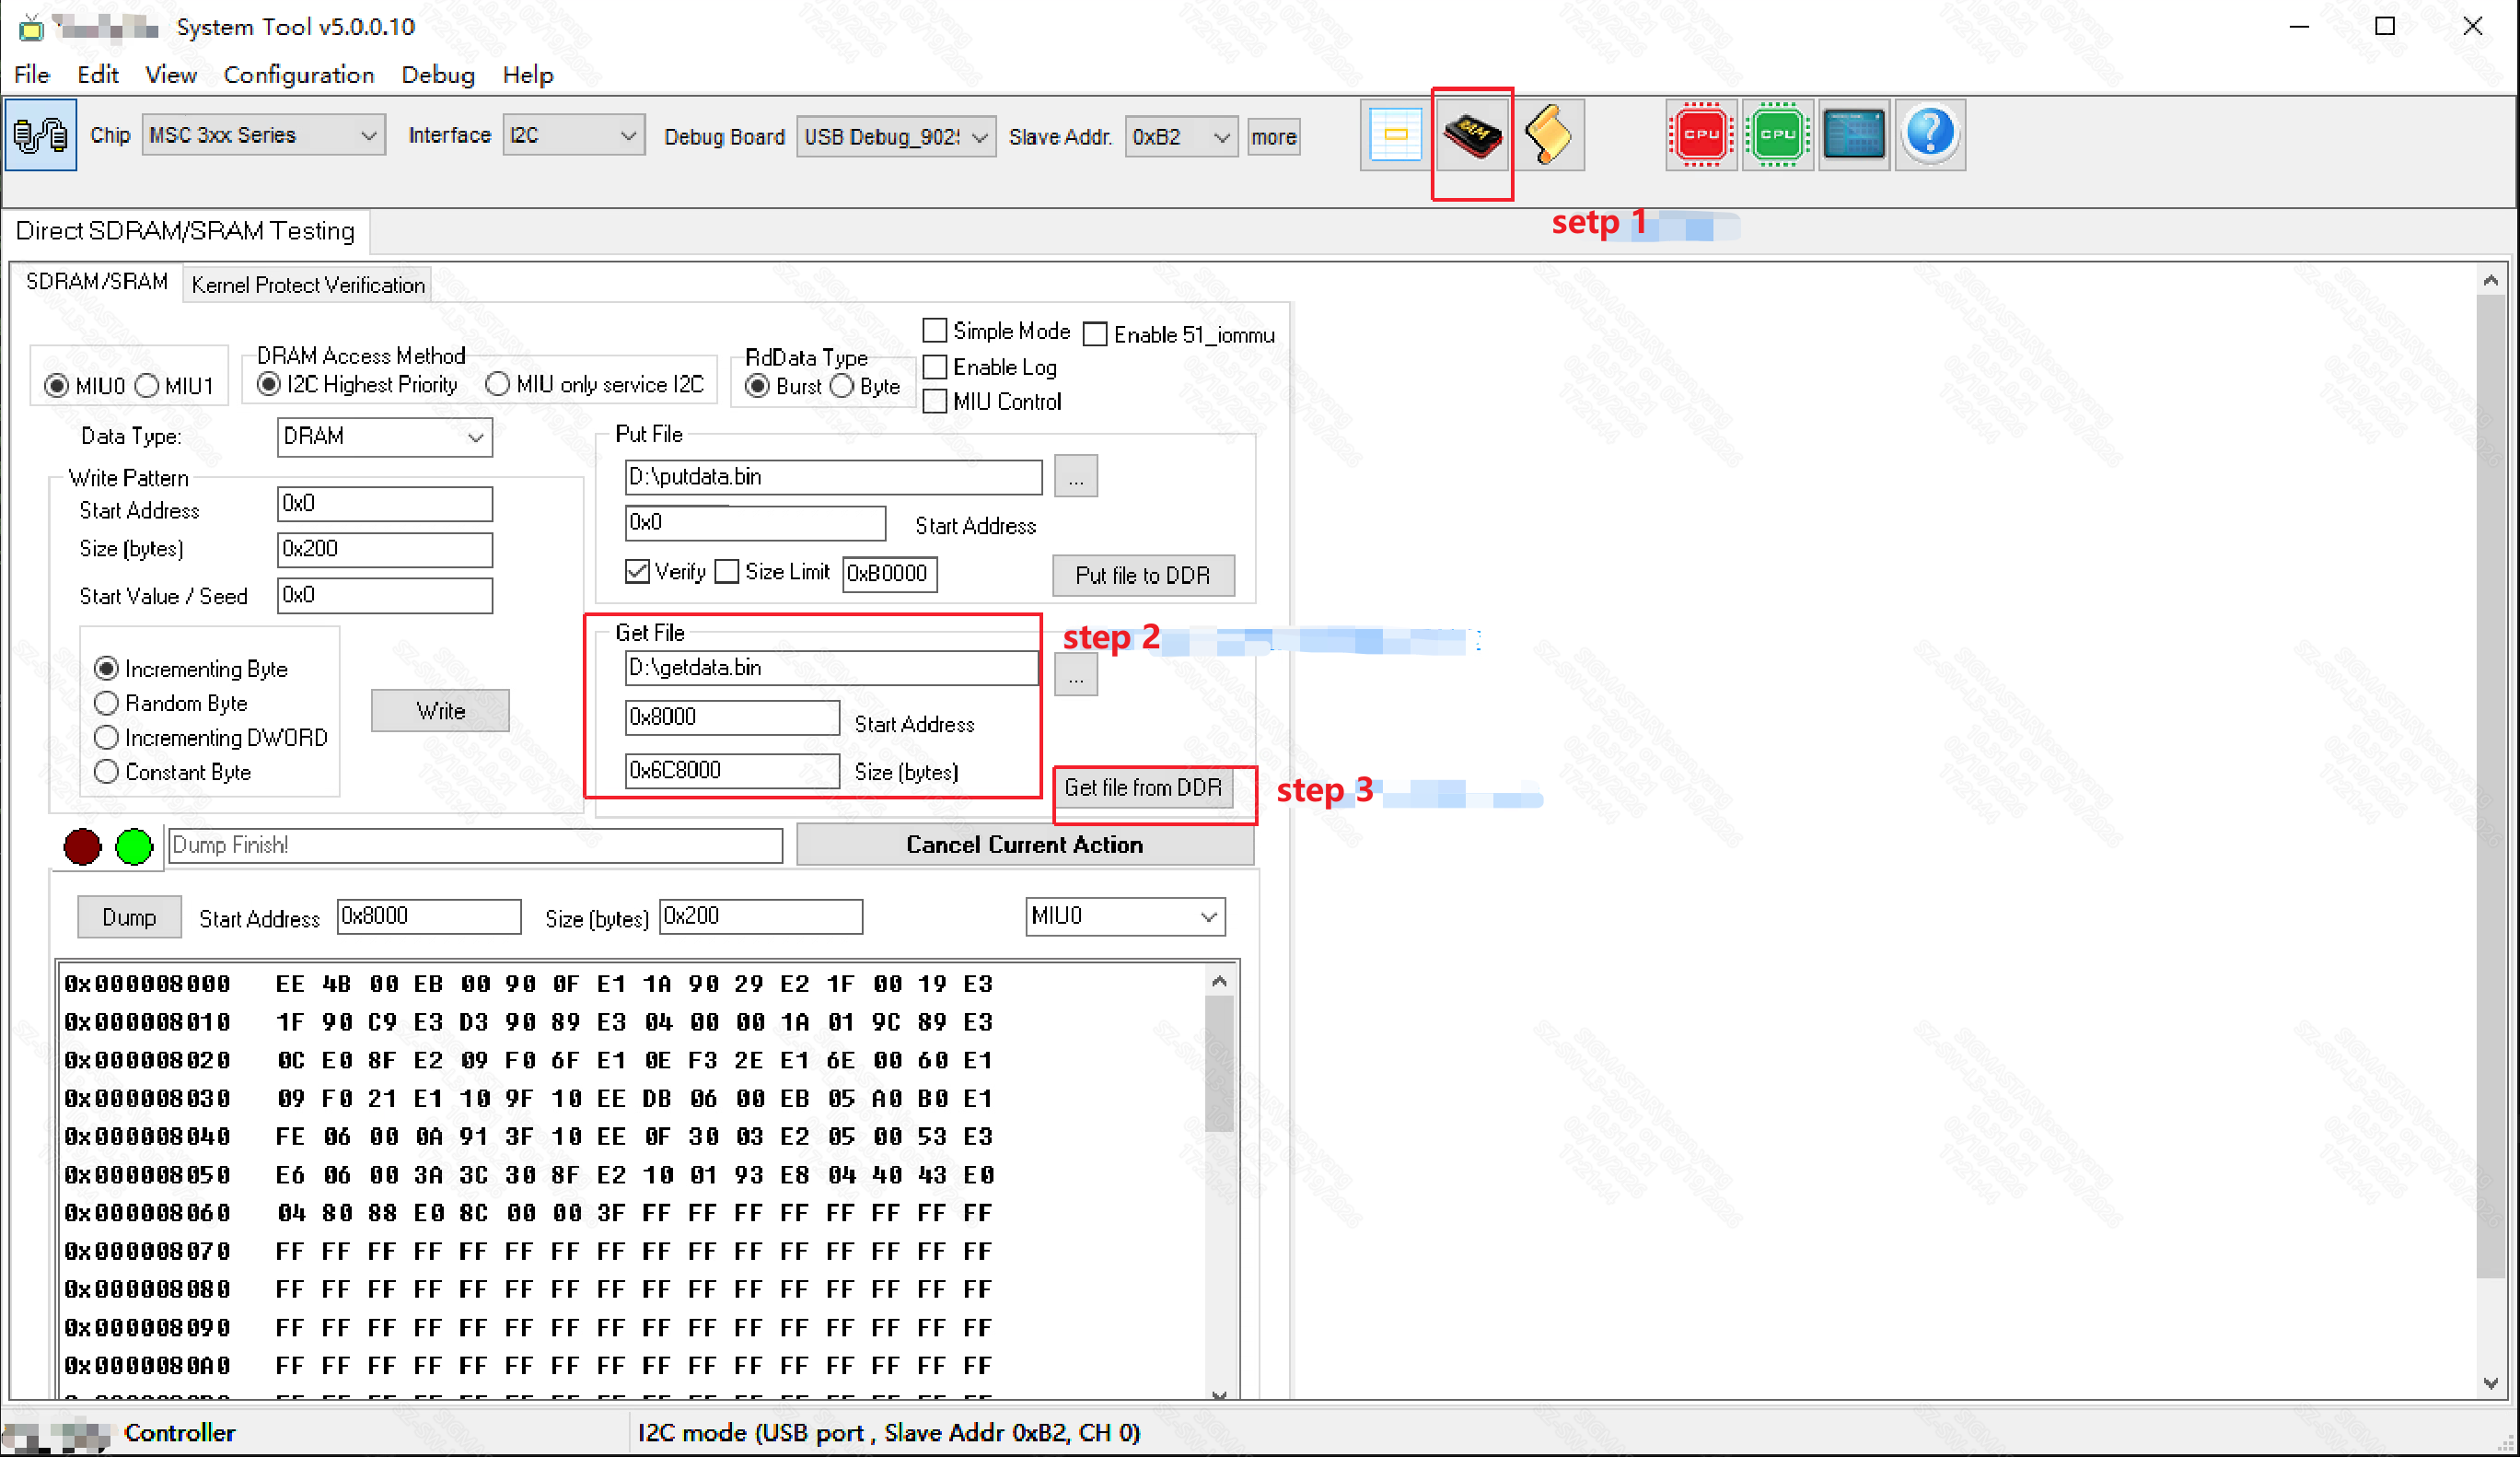
3 steps to be executed in the linux kernel directory:
# 1. size = 0xc06d0000 - 0xc0008000 = 0x6C8000

cat System.map

c0008000 T _text

...

c06d0000 R __start_rodata

# 2. addr = 0x1000008000 - 0x1000000000 = 0x8000

cat /proc/iomem

...

1000000000-107fffffff : System RAM

1000008000-100097cfff : Kernel code

10009e4000-1000b01d23 : Kernel data

# 3. Export vmlinux .text

arm-linux-gnueabihf-objcopy -j .text -O binary vmlinux k_text.bin
5. CPU Freezes Without Exception Log
5.1. dump log_buf
When the CPU freezes without an exception log, there may be some important log information that did not have time to be printed. At this time, these log information can be obtained by dumping the system's log buf.
There are several methods to determine the log buf address:
-
arm-linux-gnueabihf-linaro-9.1.0-gdb vmlinux
Reading symbols from vmlinux... (gdb) info address __log_buf Symbol "__log_buf" is static storage at address 0xc041a090. -
cat System.map |grep __log_buf
c041a090 b __log_buf -
Different chips may have differences. I6C can use TV TOOL to dump bank 0x1004 data. The __log_buf address is recorded at offset 0x8 and 0x9.
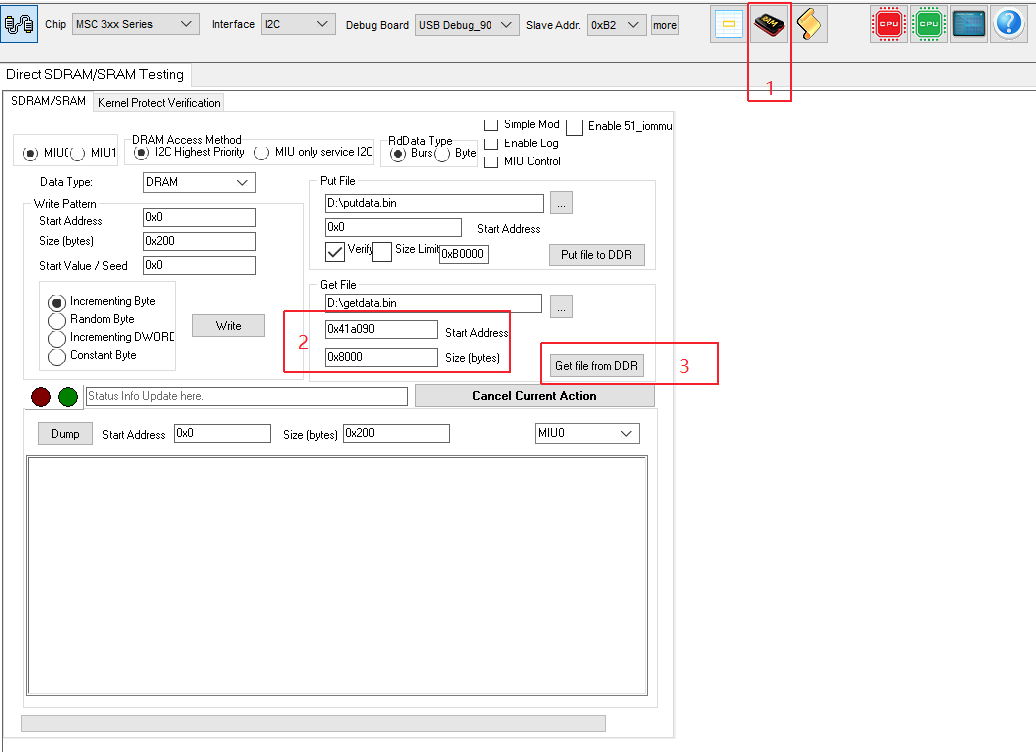
After finding the __log_buf address, you can use TV TOOL or Trace32 and other tools to dump the corresponding memory log information. The log_buf address found above is 0xc041a090. If using TV TOOL to dump log buf, you need to note one point, that is, the log_buf address dumped needs to be changed to 0x41a090 (subtract 0xc0000000). The length of dumping log buf is generally 0x8000. Refer to steps 1, 2, and 3 in the figure below.
5.2. Connect Trace32 for Debug
When the system freezes, you can use the Trace32 debug tool to view information about each thread in the system, CPU register information, cache line information, and dram data, etc.
Generally, preparations before using Trace32 are as follows:
-
If the EVB board has reserved a JTAG header, you can directly connect to Trace32.
If like the demo board or customer board does not reserve a JTAG header, you can ask the hardware owner for help.
-
Prepare the cmm scripts used by the corresponding chip on Trace32, which can be provided by SI.
-
Switch to the JTAG mode suitable for Trace32. The specific commands can be provided by SI.
The command used by Souffle EVB to switch is: /customer/riu_w 0x103c 0x60 0x0200
The command used by Iford EVB to switch is: /customer/riu_w 0x103c 0x60 0x80
6. RCU Related Issues
If an RCU stall warning occurs, you can immediately suspect that there are too many interrupts (in most cases). If there are 2 gic_handle_irq in the backtrace printed by rcu stall, you can basically lock it as an interrupt problem.
So the problem is transformed into finding out what interrupt occurs too many times.
This can be divided into two situations:
-
Can operate via serial port or telnet
Multiple cat /proc/interrupts to find suspicious IRQs.
-
Cannot operate the board
(1) You can use tv_tool to view the registers of the main interrupt controller to see which interrupt keeps occurring.
[main interrupt controller registers]
   Souffle:  /customer/riu_r 0x1009
         View fiq offset: 0x4c 0x4d 0x4e 0x4f
         View irq offset: 0x5c 0x5d 0x5e 0x5f
   Iford: /customer/riu_r 0x1009
         View fiq offset: 0x4c 0x4d 0x4e 0x4f
         View irq offset: 0x5c 0x5d 0x5e 0x5f
(2) Enable CONFIG_SSTRA_IRQ_DEBUG_TRACE, which will count the number of occurrences of each interrupt, and then print statistical information when soft lockup occurs.